How to create a two-level master-detail report
This topic explains how to create a master-detail report in dbForge Query Builder for SQL Server, including setting up relationships, organizing data, and customizing the report layout.
What is a master-detail report?
A master-detail report is a type of report that displays hierarchical data in a parent-child relationship format. It is often used to present information in a way that is easy to understand, organized, and meaningful. In this report, the “master” part refers to the higher-level, primary data (parent), while the “detail” part refers to the related, lower-level data (child).
The master-detail report presents the master data along with its related detail data. When a master item is selected or expanded, the associated detail data is displayed. This report format is particularly useful when dealing with complex datasets that have multiple levels of related data, such as sales orders and their line items, or customers and their orders.
Create a master-detail report
For demonstration purposes, we will create a master-detail report using two SQL tables - Orders as the parent table and Order_items as the child table. In this particular example, the data in the tables are not related through a foreign key.
Note
If two tables have a foreign key relationship, it will be automatically included in the master-detail report when you add these tables.
Click to see the script to create the demonstration tables
CREATE TABLE Orders (
OrderID INT PRIMARY KEY,
Name VARCHAR(255),
Address VARCHAR(255)
);

CREATE TABLE Order_Items (
ItemID INT PRIMARY KEY,
OrderID INT,
ItemName VARCHAR(255),
Qty INT
-- , FOREIGN KEY (OrderID) REFERENCES Orders(OrderID)
);


INSERT INTO Orders (OrderID, Name, Address) VALUES (1, 'John Doe', '123 Main St');
INSERT INTO Orders (OrderID, Name, Address) VALUES (2, 'Oliver Smith', '456 Park Ave');
INSERT INTO Orders (OrderID, Name, Address) VALUES (3, 'Sophia Brown', '789 Wilson Blvd');

INSERT INTO Order_Items (ItemID, OrderID, ItemName, Qty) VALUES (1, 1, 'Mountain bike', 6);
INSERT INTO Order_Items (ItemID, OrderID, ItemName, Qty) VALUES (2, 1, 'Bike tire', 12);

INSERT INTO Order_Items (ItemID, OrderID, ItemName, Qty) VALUES (3, 2, 'Smartphone', 3);
INSERT INTO Order_Items (ItemID, OrderID, ItemName, Qty) VALUES (4, 2, 'Laser mouse', 8);
INSERT INTO Order_Items (ItemID, OrderID, ItemName, Qty) VALUES (5, 2, 'USB hub', 4);
INSERT INTO Order_Items (ItemID, OrderID, ItemName, Qty) VALUES (6, 2, 'Laptop', 5);

INSERT INTO Order_Items (ItemID, OrderID, ItemName, Qty) VALUES (7, 3, 'Lipstick', 7);
INSERT INTO Order_Items (ItemID, OrderID, ItemName, Qty) VALUES (8, 3, 'Face powder', 4);
INSERT INTO Order_Items (ItemID, OrderID, ItemName, Qty) VALUES (9, 3, 'Shampoo', 2);
To create a master-detail report:
1. On the File menu, select New > Blank Data Report to open an empty report.
2. On the Data Source toolbar, click ![]() Add Tables/Views to add the tables to the report.
Add Tables/Views to add the tables to the report.
In the Add Tables/Views dialog that opens, select the tables to be added and click OK.

3. In the Data Source pane, right-click the parent table to make it active and select Set Active Item.
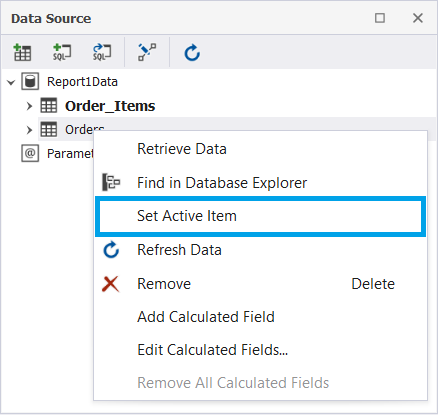
Note
To ensure the proper display of a master-detail report, it’s important to set the parent table as an active item. Failing to do so may result in the incorrect report output.
4. Since there is no pre-existing relationship between these two tables, we need to create one.
On the Data Source toolbar, click ![]() Edit Relations to create a relationship. In the Relations editor that opens, click
Edit Relations to create a relationship. In the Relations editor that opens, click  Add Relation and do the following:
- From the Parent table list, select the Orders table to designate it as the parent.
- From the Child table list, select the Orders_Items table to designate it as the child.
- From the Foreign Key Columns list, select the OrderID column that will be used to build the relationship between the two tables.
To save the changes, click OK.
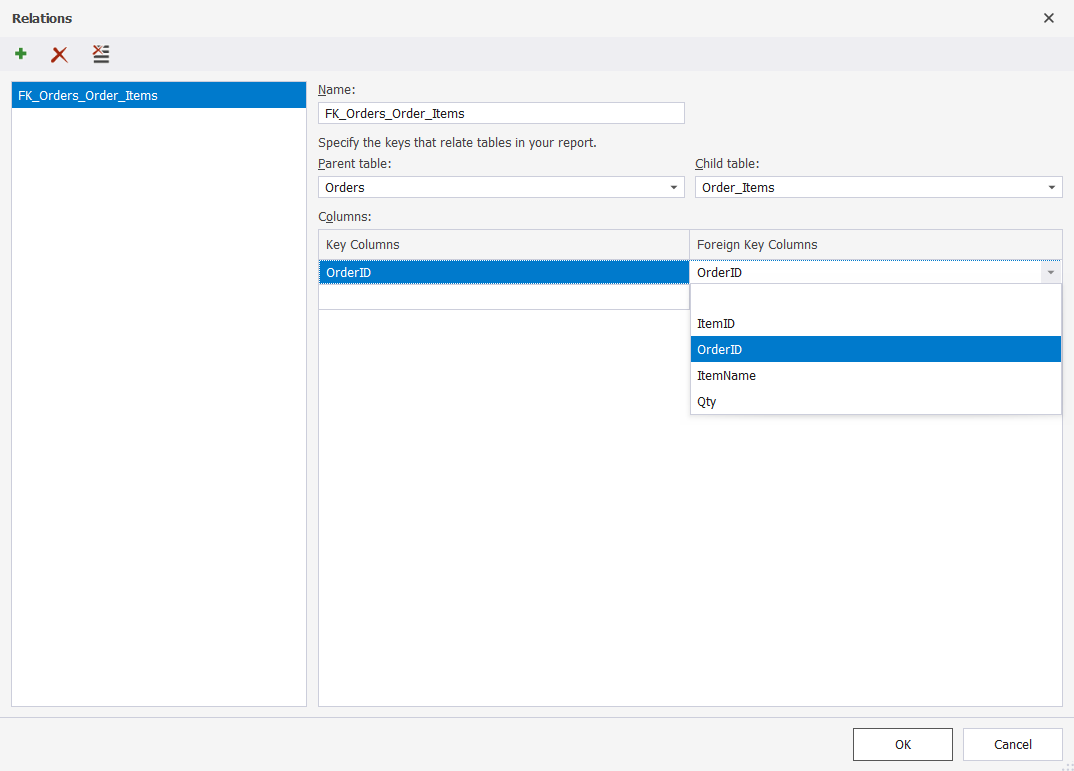
As you can see, the relation between two tables has been created.
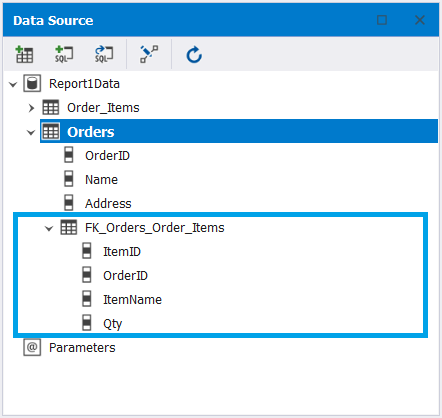
5. To display data from the parent table in the Detail area, use the Toolbox pane, which provides controls for various types of information display. To open it, go to View > Other Windows > Toolbox.
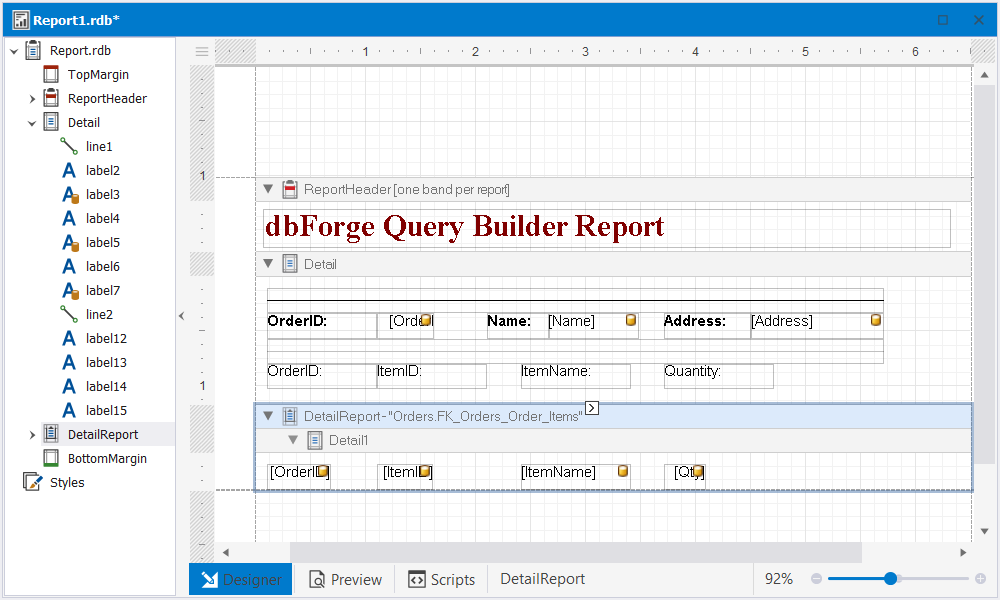
From the Toolbox pane, drag the Label control to the Detail band and double-click the field to rename it. To bind the label with the field, drag the corresponding field from the parent table in the Data Source pane and drop it next to the corresponding field in the Detail band. Repeat this step for all fields you want to display.
Note
- To speed up the process, you can select the required fields in the Data Source by holding down the Ctrl key and dragging them onto the Detail field while holding the right mouse button. This will display the fields as labels. You can then rename them according to your needs.
- Dragging the fields from the Data Source onto the Detail band while holding the left mouse button will allow binding data to the report.
For example, we drag the Label control to the Detail band and type OrderID. Next, we drag the OrderID field from the Orders table and drop it next to the bound OrderID field in the Detail band. We do the same for the Name and Address fields.
6. To create an area for displaying OrderID data, right-click the Detail area and select Insert Detail Report > FK_Orders_OrderItems. This opens the DetailReport band.
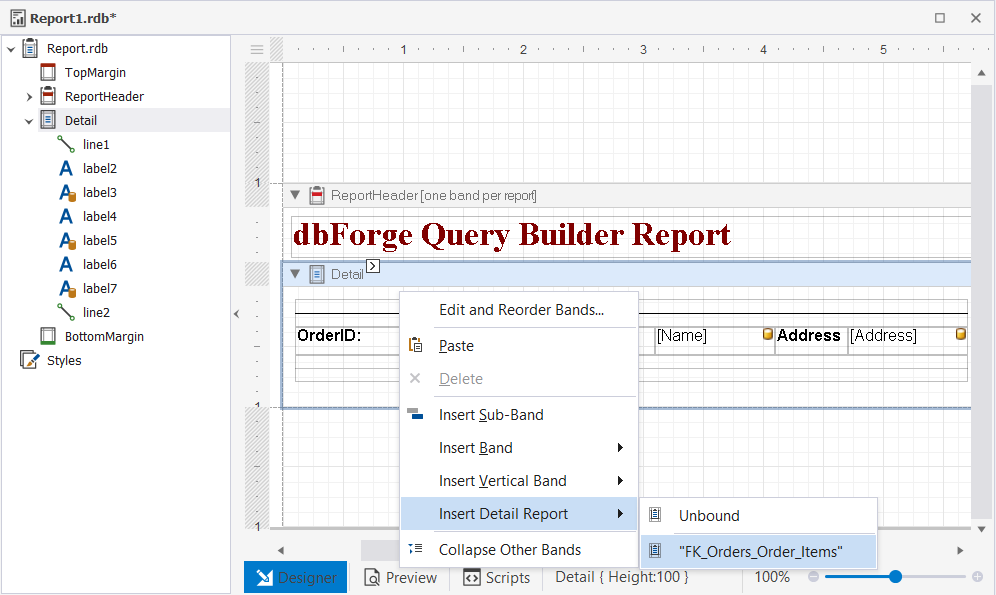
Go to Data Source and drag the required fields from FK_Orders_OrderItems onto the DetailReport area. Then, from Toolbox, drag the Label control onto the Detail area for each field you’ve added to the DetailReport area.
Note
To quickly add the required fields to your report, select them in the Data Source and drag them onto the report band. Holding down the right mouse button will display the fields as labels, which you can then rename. By dragging the selected fields while holding down the left mouse button, you will bind the data to the report.
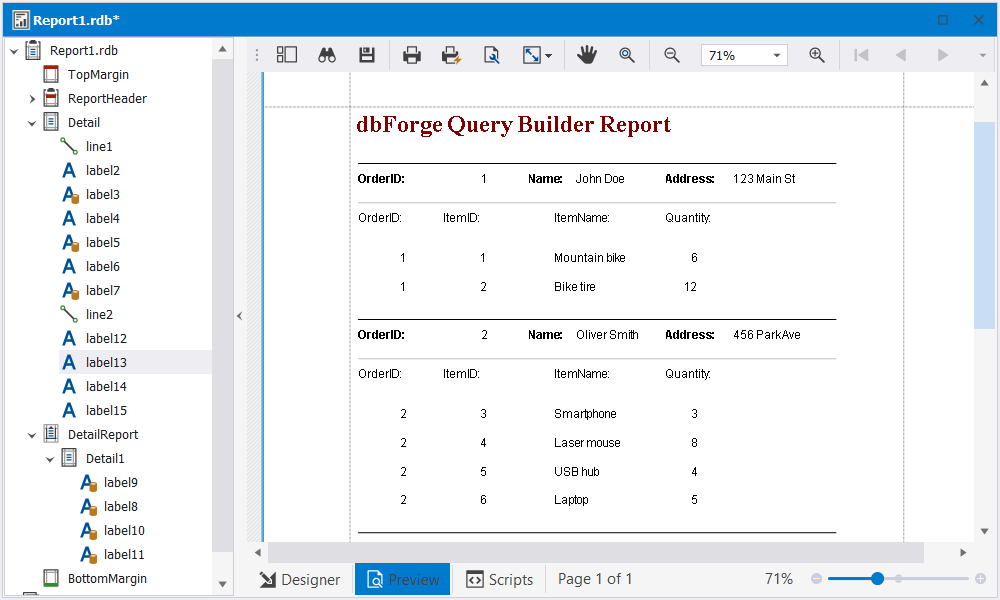
7. Once you’ve finished designing the report, switch to the Preview mode by selecting the Preview tab at the bottom of the Report Designer.
Customize the appearance of a master-detail report
Organize the report’s layout
Repeat the Group Header on every page
To display the group header on every page of your report:
1. Click to select the Group Header in the report designer.
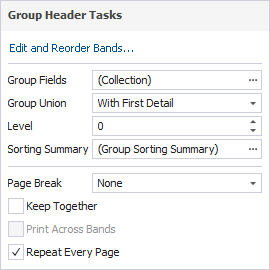
2. Click the arrow button that appears to open the Group Header Tasks dialog.
3. In the dialog, select Repeat Every Page to ensure that the group header appears on every page of the report.
4. Optional: Select With First Detail in the Group Union dropdown to ensure that the group header is always printed with at least one detail band below it.
Display master and detail data on the same page
To make sure that master and detail content always appears on the same page, go to the Group Header Tasks dialog and select Keep Together.
Style the report bands and labels for table data
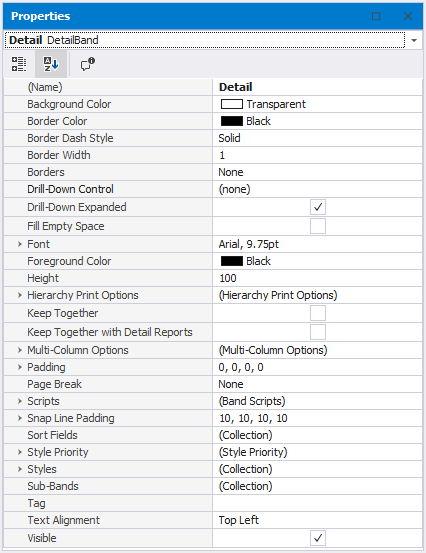
To customize the appearance of bands and labels on the report, you can use the Properties pane. To open it, select View > Properties. With it, you can change the appearance of bands and labels, such as background color, font, text alignment, and other settings.
Change data formats
To change the data format, select the required cell and click the arrowed button that will appear in the upper-right corner. The Table Cell Tasks dialog will appear.
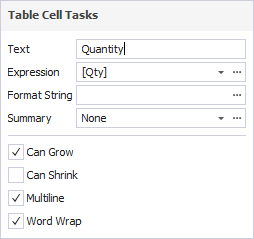
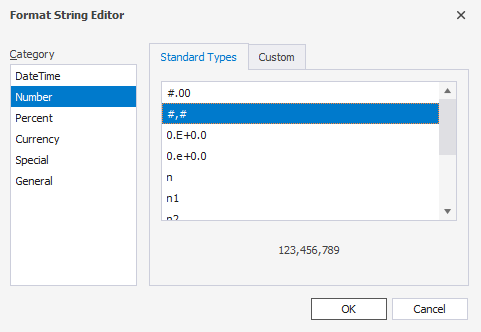
Next, click … to open the Format String Editor. Select the required data category and the format you need.
Organize blocks of data
Using the Line control, you can add horizontal, vertical, and diagonal lines to your report. You can use it to enhance the layout of your report by separating different sections or adding emphasis to certain areas. The Shape control allows adding various shapes to your report, such as rectangles, circles, triangles, and polygons. With it, you can create visually appealing shapes and frames around the report elements.
You can also include additional elements in your report such as text, images, table of contents, and charts if necessary.
Note
dbForge Query Builder for SQL Server reports offer a wide range of customization options, of which we have highlighted only a few in this topic.
See also:
To discover how to create a master-detail report with the Report Designer feature, watch this video.