How to create a three-level master-detail report
This topic explains how to create a three-level master-detail report in dbForge Query Builder for SQL Server.
Prerequisites
Before building a master-detail report, we created the following SQL tables and populated them with test data - SalesTerritory as the parent table and SalesOrderHeader and SalesOrderDetail as the child tables.
Click to see the script to create the demonstration tables and populate them with data
-- Level 1: Sales Territories (with territory names)
CREATE TABLE SalesTerritory (
TerritoryID INT PRIMARY KEY,
TerritoryName NVARCHAR(100) NOT NULL
);

-- Level 2: Orders (with customer names)
CREATE TABLE SalesOrderHeader (
    SalesOrderID INT PRIMARY KEY,
    CustomerName NVARCHAR(100) NOT NULL,
    TerritoryID INT NOT NULL,
    TotalDue DECIMAL(10,2) NOT NULL,
    CONSTRAINT FK_SalesOrderHeader_Territory FOREIGN KEY (TerritoryID)
        REFERENCES SalesTerritory(TerritoryID)
);

-- Level 3: Order Details (with product names)
CREATE TABLE SalesOrderDetail (
    SalesOrderDetailID INT PRIMARY KEY,
    SalesOrderID INT NOT NULL,
    ProductName NVARCHAR(100) NOT NULL,
    OrderQty INT NOT NULL,
    UnitPrice DECIMAL(10,2) NOT NULL,
    LineTotal AS (OrderQty * UnitPrice) PERSISTED,
    CONSTRAINT FK_SalesOrderDetail_SalesOrderHeader FOREIGN KEY (SalesOrderID)
        REFERENCES SalesOrderHeader(SalesOrderID)
);

-- Inserting data into SalesTerritory table (Level 1: Sales Territories)
INSERT INTO SalesTerritory (TerritoryID, TerritoryName)
VALUES
(1, 'North'),
(2, 'South'),
(3, 'East'),
(4, 'West');

-- Inserting data into SalesOrderHeader table (Level 2: Orders)
INSERT INTO SalesOrderHeader (SalesOrderID, CustomerName, TerritoryID, TotalDue)
VALUES
(1001, 'John Doe', 1, 1500.00),
(1002, 'Alice Smith', 2, 1800.00),
(1003, 'Bob Johnson', 3, 2400.00),
(1004, 'Emily Davis', 4, 900.00),
(1005, 'David Wilson', 2, 1100.00);


-- Inserting data into SalesOrderDetail table (Level 3: Order Details)
INSERT INTO SalesOrderDetail (SalesOrderDetailID, SalesOrderID, ProductName, OrderQty, UnitPrice)
VALUES
-- For John Doe (SalesOrderID 1001, Territory 1)
(1, 1001, 'Laptop Pro 15', 1, 1000.00),
(2, 1001, 'Wireless Mouse', 2, 25.00),
(3, 1001, 'Bluetooth Headphones', 1, 200.00),

-- For Alice Smith (SalesOrderID 1002, Territory 2)
(4, 1002, '4K Monitor', 1, 500.00),
(5, 1002, 'Mechanical Keyboard', 1, 300.00),
(6, 1002, 'Smartwatch 5', 1, 500.00),

-- For Bob Johnson (SalesOrderID 1003, Territory 3)
(7, 1003, 'Smartphone X', 1, 1200.00),
(8, 1003, 'Bluetooth Headphones', 1, 200.00),
(9, 1003, 'Wireless Headphones', 1, 150.00),

-- For Emily Davis (SalesOrderID 1004, Territory 4)
(10, 1004, 'Tablet Pro 10', 1, 400.00),
(11, 1004, 'Wireless Mouse', 2, 25.00),

-- For David Wilson (SalesOrderID 1005, Territory 2)
(12, 1005, 'Smartwatch 5', 1, 500.00),
(13, 1005, '4K Monitor', 1, 500.00);
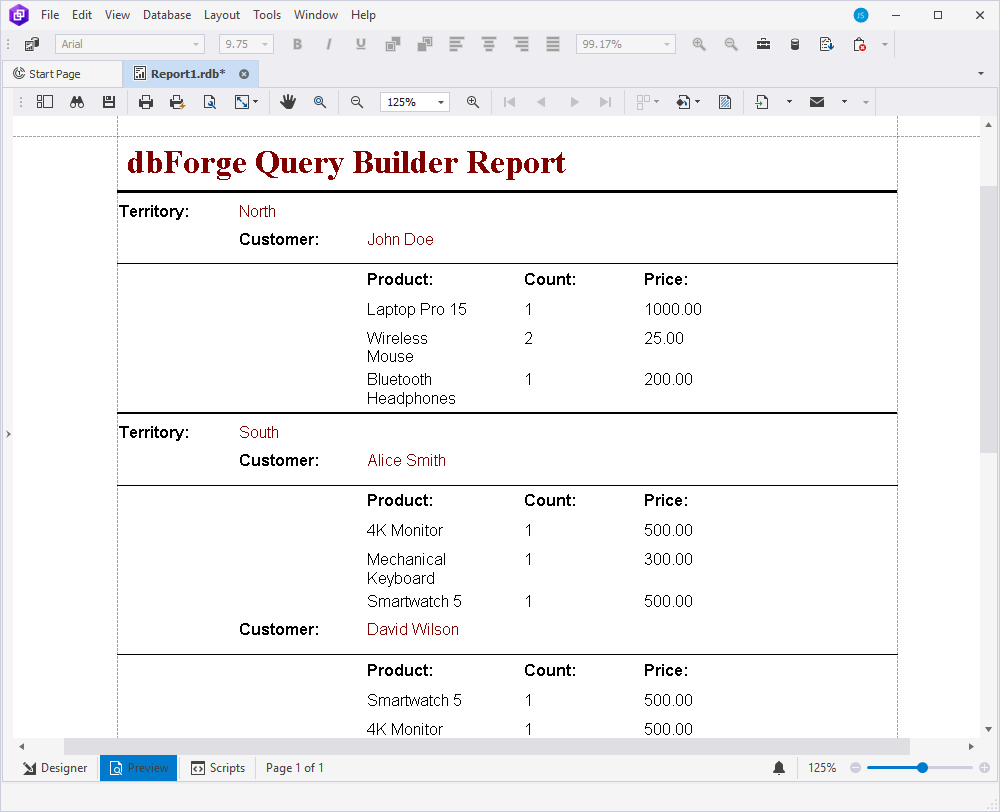
For demonstration purposes, we will create a report that summarizes the information from those three tables. Each section in the report is separated by cross-band lines and displays customer information. It includes the territory where the customer placed the order and associated order details, such as product, quantity, and price.
The workflow to create a three-level master-detail report could be as follows:
- Step 1: Add the tables to the report
- Step 2: Create a relationship between tables
- Step 3: Display data from the parent table in the report
- Step 4: Display data from the bound SalesOrderHeader child table in the report
- Step 5: Display data from the bound SalesOrderDetail child table in the report
- Step 6: Preview the report
Step 1: Add the tables to the report
1. Open Report Designer by navigating to the File menu and selecting New > Blank Data Report.
2. Add the tables that will serve as the data source for the report:
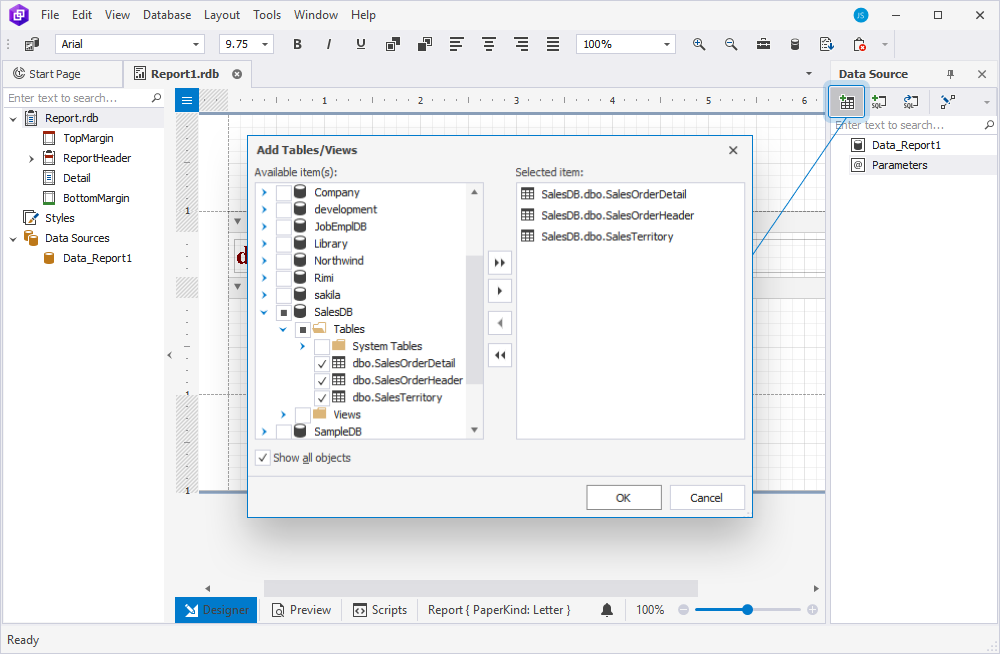
2.1. On the Data Source toolbar, select ![]() Add Tables/Views.
Add Tables/Views.
2.2. In the Add Tables/Views dialog that opens, select the checkboxes next to the tables you want to add and select OK. In our case, the tables are SalesTerritory, SalesOrderHeader, and SalesOrderDetail.
Alternatively, select the table and then select ![]() in the dialog. The selected tables appear in the Selected Item section of the dialog.
in the dialog. The selected tables appear in the Selected Item section of the dialog.
2.3. Select OK to add the tables to Report Designer.
3. The Data Source pane now displays the tables with the fields.
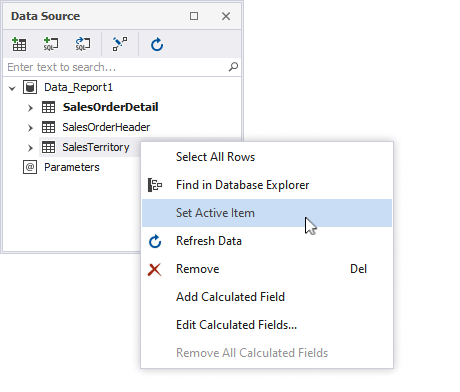
4. In the Data Source pane, right-click the parent table to make it active and select Set Active Item. In our case, the parent table is SalesTerritory.
Note
To ensure the master-detail report displays correctly, you must set the parent table as the active item. Otherwise, the report output may be inaccurate.
Step 2: Create a relationship between tables
Creating relationships between tables in a master-detail report ensures that data is properly linked and displayed in a structured manner.
Note
If the tables have a foreign key relationship, it will be automatically included in the master-detail report when the tables are added. In this case, you can skip Step 2.
To create a relationship between the tables:
1. On the Data Source toolbar, select ![]() Edit Relations to create a relationship.
Edit Relations to create a relationship.
2. In the Relations editor that opens, select  Add Relation.
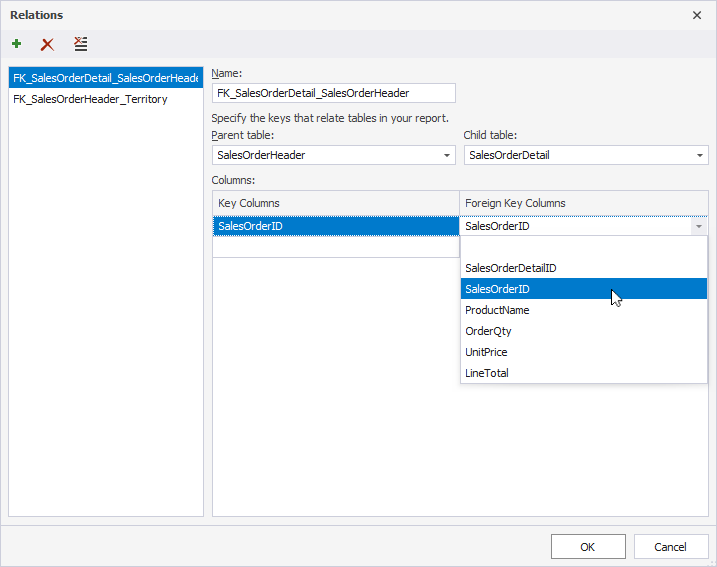
3. In the Relations dialog, do the following:
- From the Parent table list, select the table to set it as the parent.
- From the Child table list, select the table to set it as the child.
- From the Foreign Key Columns list, select the column to build the relationship between the two tables.
4. To save the changes, select OK. Repeat this for each relationship you need to create.
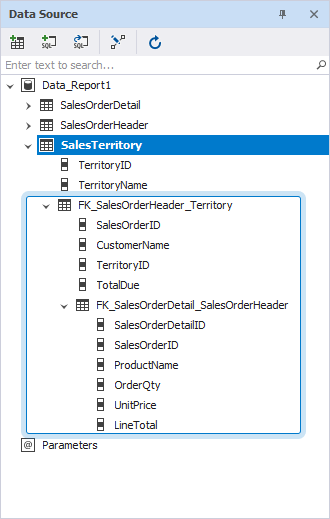
5. The Data Source pane displays the relationship as follows:
Step 3: Display data from the parent table in the report
1. Create a label for each field and bind it to the corresponding data:
Tip
If the Toolbox pane is hidden, open it by navigating to View > Other Windows > Toolbox.
-
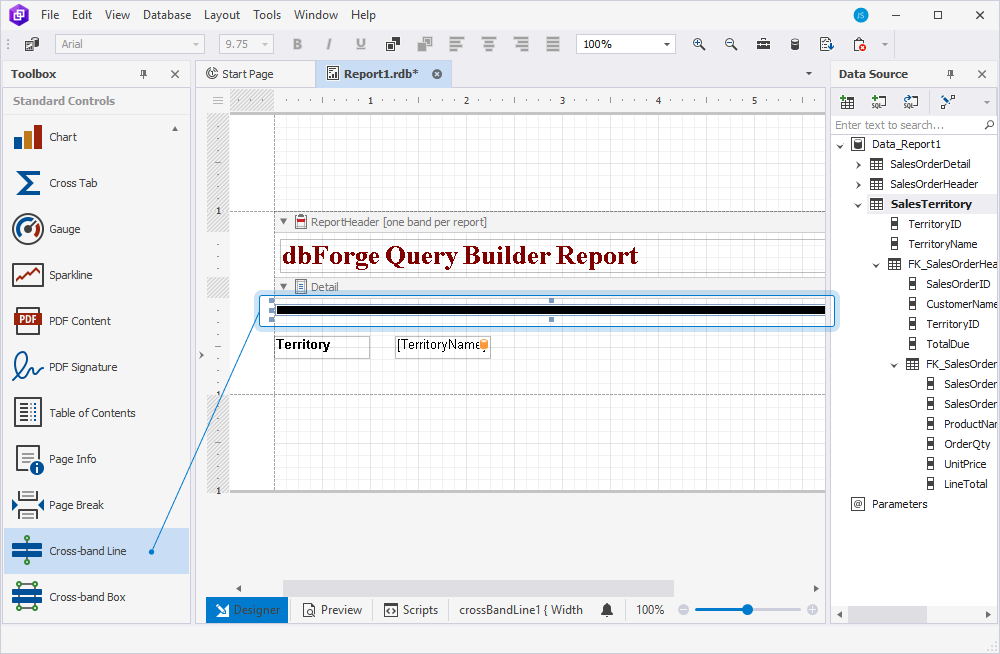
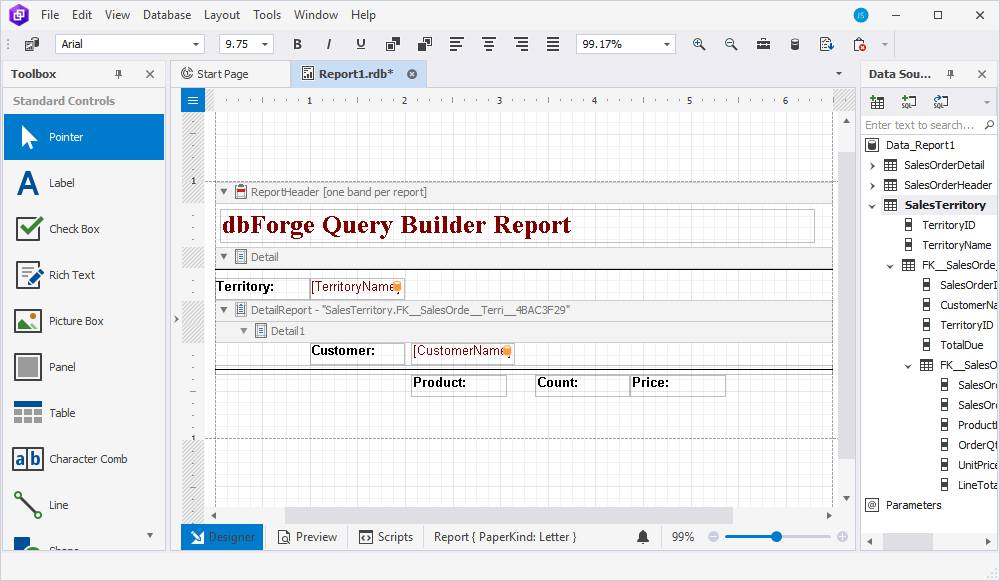
To create a label, drag Label from the Toolbox pane to the Detail band of the report – add one label for each field you want to display. Then, double-click the default text in the Label control to change it. In our example, the new text is Territory:.
-
To bind the label to the data field and display the corresponding data from the parent table, drag the required data field from the Data Source pane to the report Detail band next to the required label. In our example, it is the TerritoryName data field from the SalesTerritory table.
Note
To speed up the process, hold Ctrl, select the required fields in the Data Source pane, and drag them onto the Detail band using the right mouse button. The fields will be added as labels, which you can then rename as needed.
To bind data to the report, drag the fields from the Data Source pane onto the Detail band while using the left mouse button.
2. Add horizontal lines to visually separate each territory section: From Toolbox, drag Cross-band Line onto the desired position. Then, use the sizers and mouse to stretch the line horizontally across the entire report.
Step 4: Display data from the bound SalesOrderHeader child table
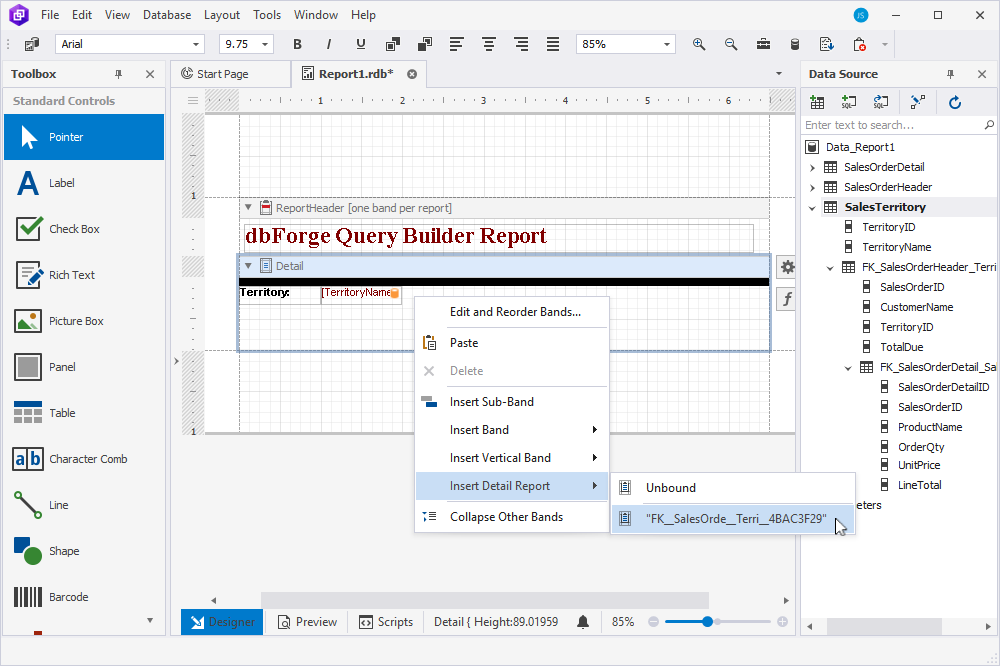
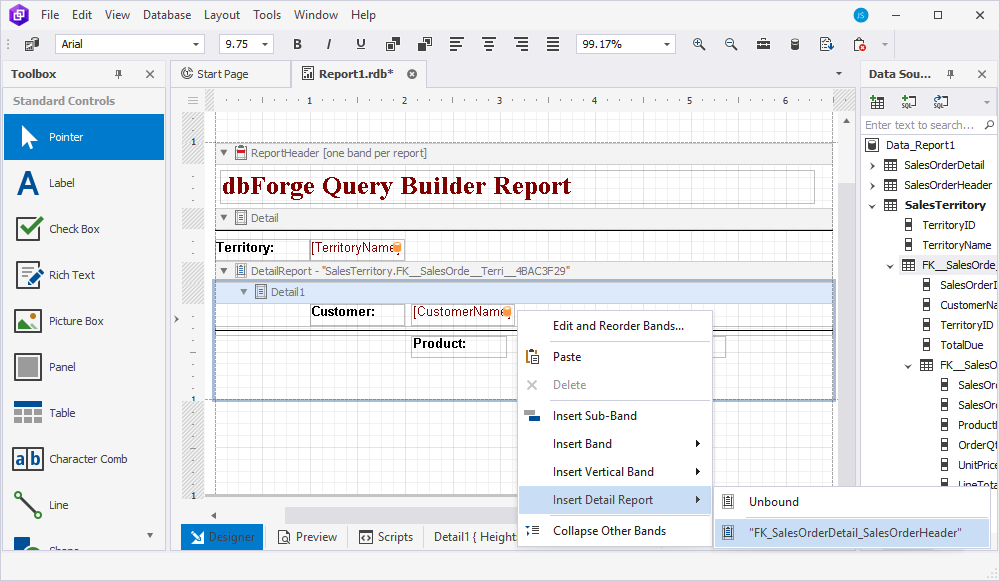
1. To create an area for displaying SalesOrderHeader data, right-click the Detail area and select Insert Detail Report > FK_SalesOrderHeader_Territory. This opens the DetailReport > Detail1 band.
2. From the Data Source pane, drag the required fields from FK_SalesOrderHeader_Territory onto the DetailReport > Detail1 area.
3. Create a label for each field and bind it to the corresponding data:
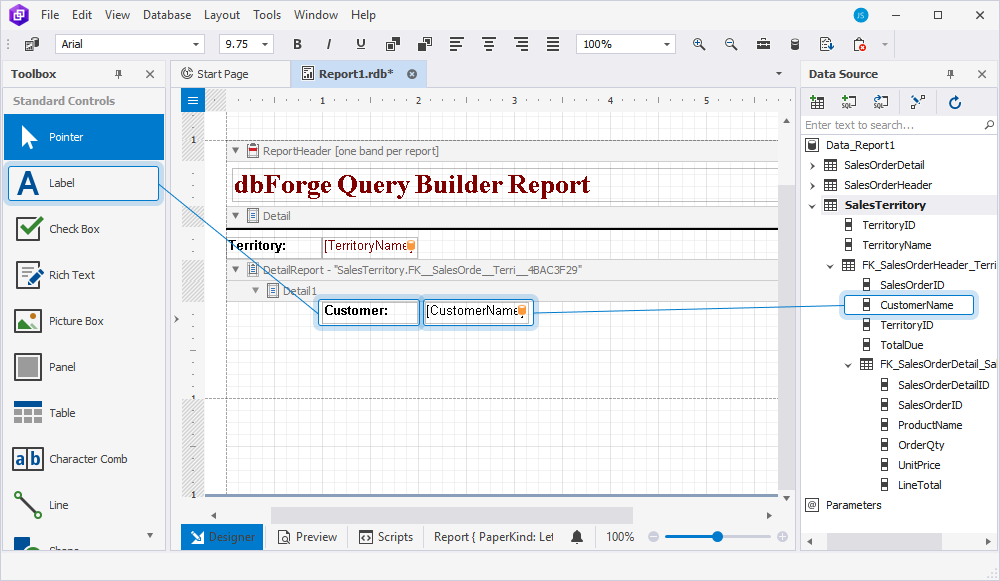
3.1. To create a label, drag Label from Toolbox onto the DetailReport > Detail band of the report – add one label for each field you want to display. Then, double-click the default text in the Label control to rename it. In our example, the new text will be Customer:.
3.2. To bind the label to a data field and display the corresponding value from the SalesOrderHeader child table, drag the desired field from Data Source > FK_SalesOrderHeader_Territory to the Detail1 band next to the appropriate label. In our example, it is CustomerName from the FK_SalesOrderHeader_Territory table.
Note
To quickly add the required fields to your report, select them in the Data Source pane and drag them onto the report band:
- Right-click and drag to insert the fields as labels, which you can rename as needed.
- Left-click and drag to bind the data fields directly to the report.
4. Add a horizontal line to separate the SalesOrderHeader data from the rest of the report content. To do this, drag Line from Toolbox to the desired location and use the sizers to stretch it horizontally across the page.
5. Prepare the headers for displaying data from the SalesOrderDetail table:
5.1. To create a label, drag Label from Toolbox to the Detail1 band of the report and place it below the line. Then, double-click the default text in the Label control to rename it. Repeat this step as many times as you need. In our case, we add the following labels under the line: Product, Count, and Price. Repeat this step for all the labels you need.
Note
To move elements within the area, select them and drag them to the desired position.
Step 5: Display data from the SalesOrderDetail child table
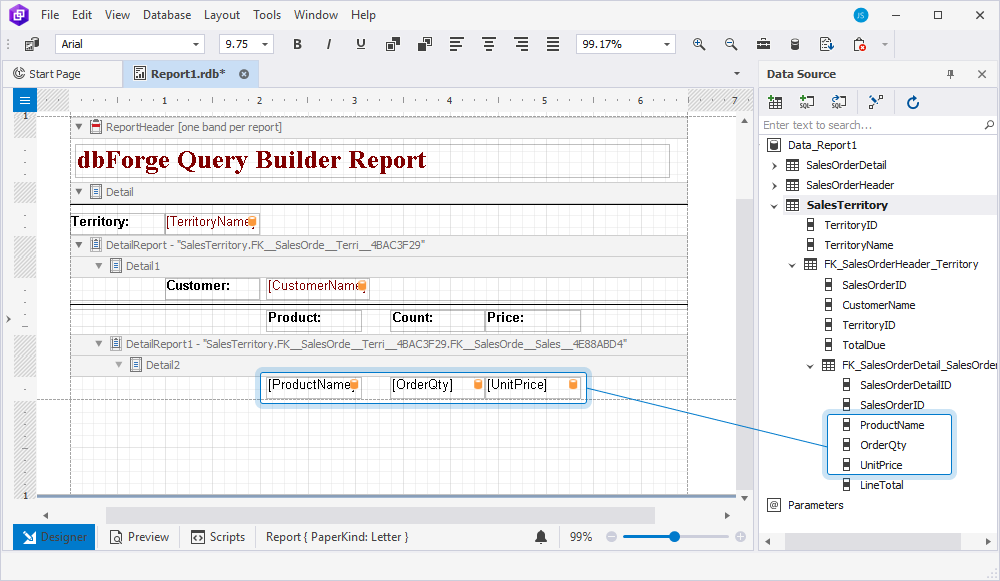
1. Right-click the Detail1 area and select Insert Detail Report > FK_SalesOrderDetail_SalesOrderHeader. This opens the DetailReport1 > Detail2 band.
2. From the Data Source pane, drag the respective fields from FK_SalesOrderDetail_SalesOrderHeader onto the DetailReport1 > Detail2 area under the Product, Count, and Price labels, respectively.
Step 6: Preview the report
Once you’ve finished designing the report, switch to the Preview mode by selecting the Preview tab at the bottom of Report Designer.
Change value color
To change the value color:
1. Select the cell whose value you want to change.
2. On the Data Report toolbar, select ![]() Foreground Color.
Foreground Color.
3. In the Color window that opens, select the color and select OK to save the changes.
For more information about how to customize the report appearance, see Customize the appearance of a master-detail report