How to create a simple data-aware report
In this example, a report will be bound to data from the Orders data table of the AdventureWorks2019 database.
Note
Prior to working with a data-aware report, it is recommended that you review Create a Static Report. It will help you learn how to create a simple report with the dbForge tool.
You can create a data-aware report either using Data Report Wizard or Report Designer.
To create a report with the Data Report Wizard
1. On the Database menu, click Report Designer.
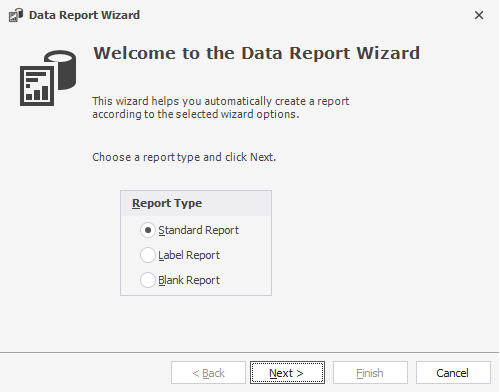
2. In the Data Report Wizard that opens, select the type of the report and click Next. In our case, it is a Standard Report.
3. Select a connection, a data type, and click Next. In our case, we select the Simple Table/View option.
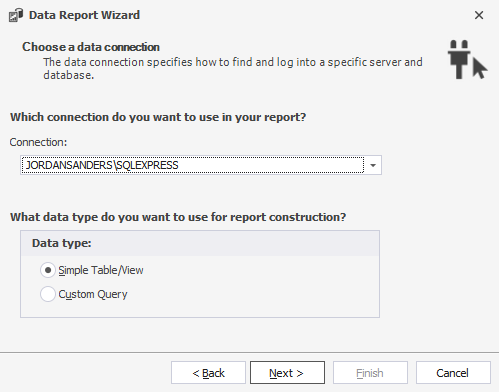
The Custom Query option allows you to create a report either by adding a new SQL statement or opening the existing one. For more information how to create a report with a custom query, see Creating a report with a custom query.
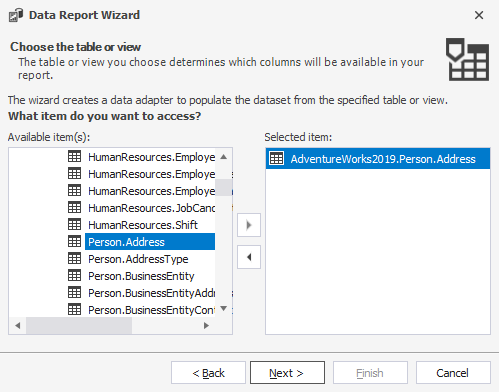
4. On the Choose the table or view page, select the table or view from which you want to add columns to the report and click Next.
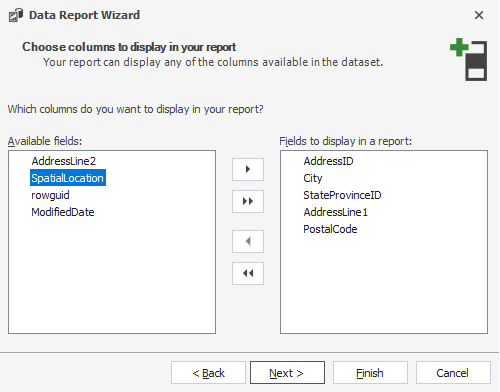
5. On the Choose columns to display in your report page, select the columns to be added to the report and click Next.
6. On the Grouping page, you can combine values into groups and set their priority. Then, click Next.
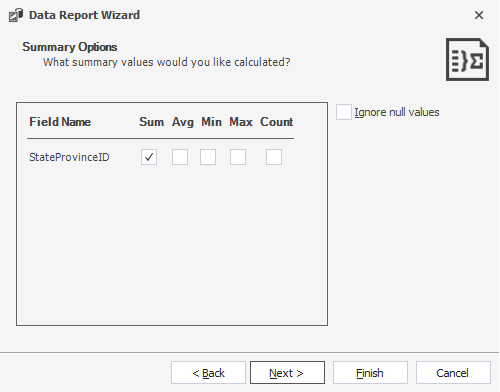
7. On the Summary Options page, you can do the following and then click Next:
- Select summary values to be calculated.
- Select the Ignore null values option.
8. On the next page, adjust the layout of the report and click Next.
9. Adjust the report appearance and click Next.
10. Enter the title of the report and click Finish.
To create a data-aware report with Report Designer
1. On the File menu, select New > Blank Data Report.
2. On the Data Report toolbar, click Data Source Window. It enables you to add report controls to the report and bind them to data. To open the Data Source pane, click  Data Source Window.
3. Drag the table from Database Explorer to the Data Source window to add the table to the report. Now, your report is bound to data.
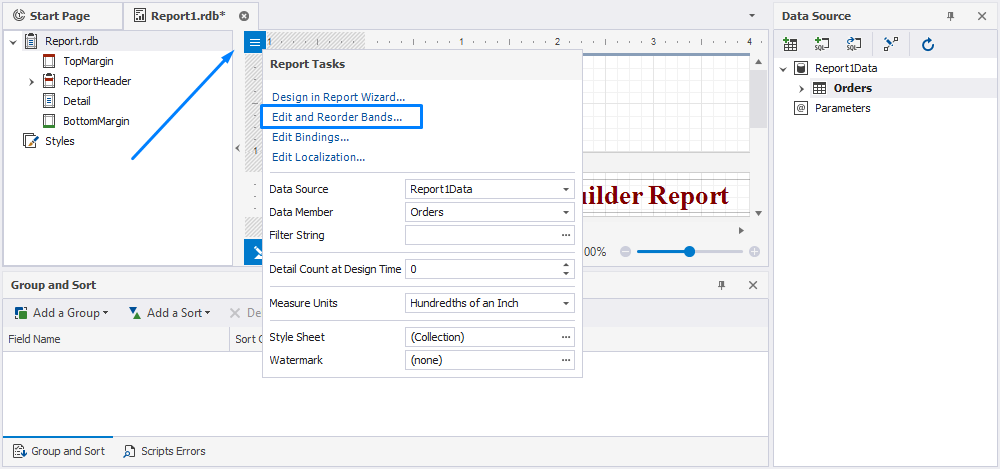
4. Click the top-left corner of the Report Designer to invoke the report smart tag. Then, select Edit and Reorder Bands to edit the collection of report bands.
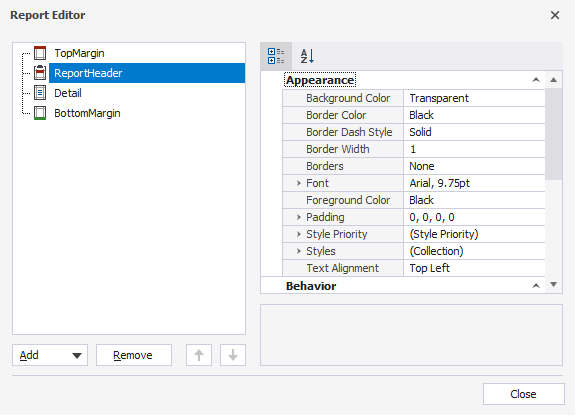
5. In the Report Editor dialog that opens, click the Add drop-down list and select Band > PageFooter. Then, click Close.
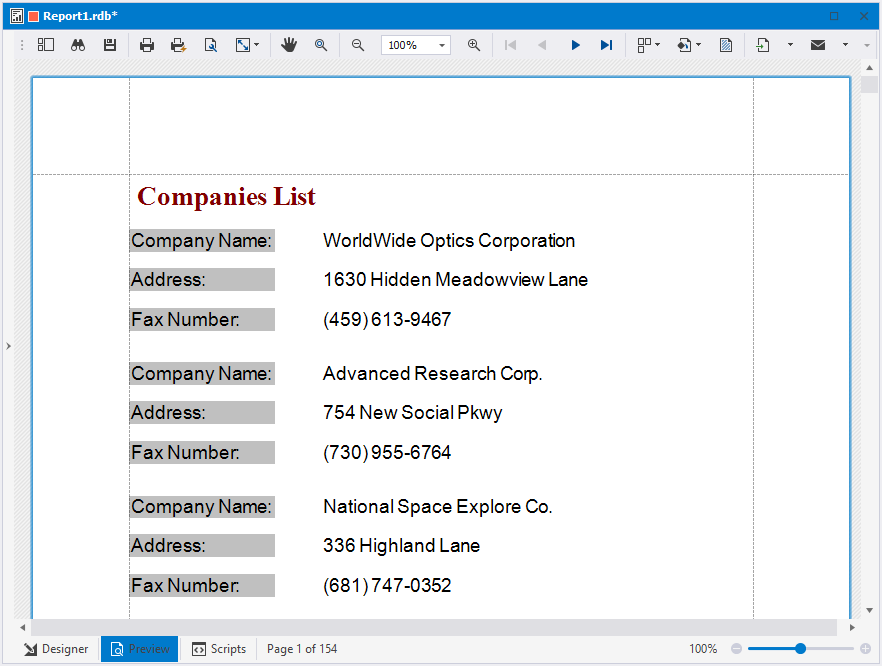
6. In the ReportHeader band, change the default text to ‘Companies List’.
7. Switch to the Detail band. Create three labels by dragging Label to the Detail band from the Toolbox window. Then, change the default text to ‘Company name:’, ‘Address:’, and ‘Fax number:’ respectively.
8. To bind three labels to the ‘Company name:’, ‘Address:’, and ‘Fax number:’ data fields, drag the corresponding data fields from the Data Source tree and drop them onto the report’s Detail band.
9. To add page numbers to the bottom of each page in the report, in Report Designer, select PageFooter band. Then, drag PageInfo from Toolbox and drop it onto the PageFooter band. To change the format of page numbers shown in the report, invoke the control smart tag by clicking the top-right corner of the control. For instance, set this property value to ‘Current of Total’ Page Numbers.
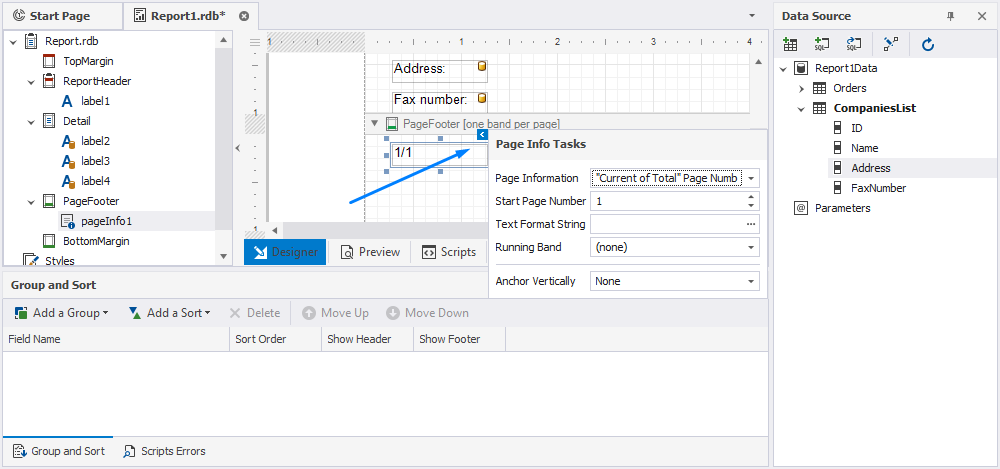
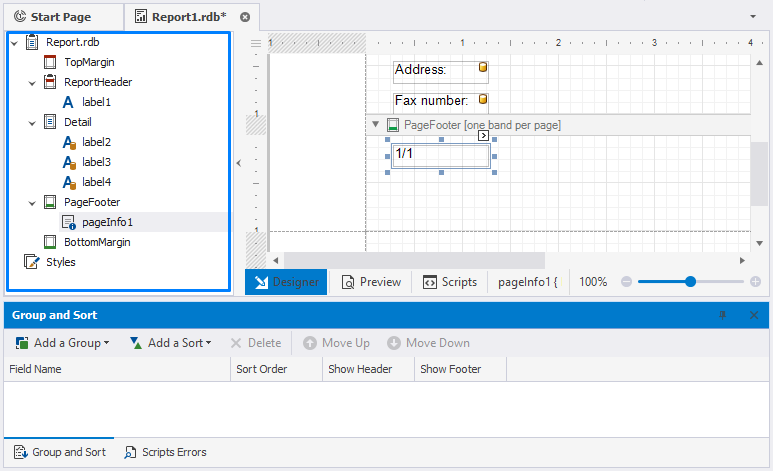
The data-aware report is ready to use. Its structure is shown on the left side of the report document. Note that bound controls are marked with yellow database icons.
10. Save the report to keep the changes.
You can preview the report by switching to the Preview tab at the bottom of the Document area.
