Overview of Report Designer tools
The image shows the main Report Designer tools used to create and customize data reports.
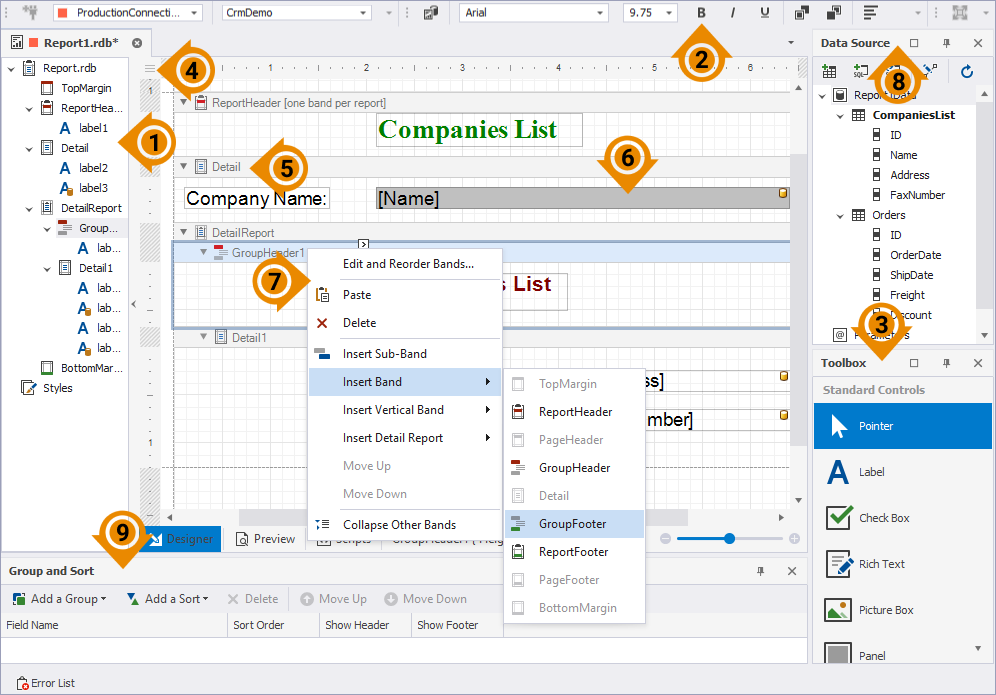
The table gives a brief description of each element marked on the image:
| ID | Name | Description |
|---|---|---|
| 1 | Report Structure | Quick and easy navigation through the report elements. |
| 2 | Report Designer toolbar | Controls to change font properties, to access the toolbox, Data Source, and Group and Sort windows, and to zoom in or out the Report Designer surface. |
| 3 | Toolbox | Controls to customize data reports. |
| 4 | Smart Tag | Options to display context-sensitive information and commands in report controls and bands. |
| 5 | Band Strips | A strip with the band name, band icon, and Expand/Collapse displayed on top of every report band. Strips are omitted when generating a report document. |
| 6 | In-Place editor | Editor to enter the text or input. |
| 7 | Shortcut menu | Additional options to be used for data reports that depend on the context. |
| 8 | Data Source | Hierarchical structure of the data source currently bound to a report. |
| 9 | Group and Sort | Controls to apply grouping and sorting to a report. |