


Report building basics
Last modified: January 26, 2022
To start working with the reports, you can use the Report Designer toolbar.

Every report consists of bands, and every band contains report controls inside it. Reports can be either bound to data or unbound. Unbound reports may contain text, images, etc. provided manually without using any data source.
Bound to data reports are used to present the required information in a readable form, so this is the most important feature of all report generators. To create a data-bound report, bind the report to a data source and then specify data-binding options for report controls.
A report can be created using Data Report Wizard or the Blank Data Report option. It is possible to save the created report to an RDB file. For more information, see How to save reports in SQL Server. If a report uses stylesheets, they can be saved to a REPSS file. Also, you can load styles from a created earlier REPSS file.
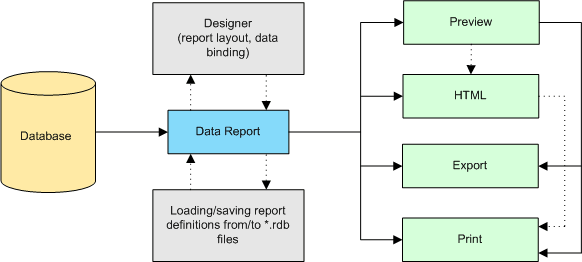
After a report was created, you can preview, save, or print it. The diagram illustrates the report’s life cycle in dbForge Query Builder:
For more information about the report elements, see Report Bands and Report Controls.
'%3e%3cpath%20id='thumb_up_2'%20d='M15%2017H5.5V7L11.5%201L12.1667%201.45833C12.4028%201.625%2012.5833%201.83681%2012.7083%202.09375C12.8333%202.35069%2012.8681%202.61806%2012.8125%202.89583L12.7917%203L12%207H17.5C17.9167%207%2018.2708%207.14583%2018.5625%207.4375C18.8542%207.72917%2019%208.08333%2019%208.5V9.6875C19%209.79861%2018.9896%209.89931%2018.9688%209.98958C18.9479%2010.0799%2018.9167%2010.1736%2018.875%2010.2708L16.3944%2016.0875C16.2703%2016.3625%2016.0833%2016.5833%2015.8333%2016.75C15.5833%2016.9167%2015.3056%2017%2015%2017ZM7%2015.5H15L17.5%209.6875V8.5H10.1667L11.1875%203.4375L7%207.625V15.5ZM5.5%207V8.5H2.5V15.5H5.5V17H1V7H5.5Z'%20fill='%2327282C'/%3e%3c/g%3e%3c/g%3e%3c/svg%3e) Yes
Yes'%3e%3cpath%20id='thumb_down_2'%20d='M5%203H14.5V13L8.5%2019L7.83333%2018.5417C7.59722%2018.375%207.41667%2018.1632%207.29167%2017.9062C7.16667%2017.6493%207.13194%2017.3819%207.1875%2017.1042L7.20833%2017L8%2013H2.5C2.08333%2013%201.72917%2012.8542%201.4375%2012.5625C1.14583%2012.2708%201%2011.9167%201%2011.5V10.3125C1%2010.2014%201.01042%2010.1007%201.03125%2010.0104C1.05208%209.92014%201.08333%209.82639%201.125%209.72917L3.60417%203.91667C3.71528%203.63889%203.89931%203.41667%204.15625%203.25C4.41319%203.08333%204.69444%203%205%203ZM13%204.5H5L2.5%2010.3125V11.5H9.83333L8.8125%2016.5625L13%2012.375V4.5ZM14.5%2013V11.5H17.5V4.5H14.5V3H19V13H14.5Z'%20fill='%2327282C'/%3e%3c/g%3e%3c/g%3e%3c/svg%3e) No
No'%3e%3cpath%20id='Vector'%20d='M4%204V24H24V4H4ZM22%2022H6V9H22V22ZM19%2019H9V18H19V19ZM19%2016H9V15H19V16ZM19%2013H9V12H19V13ZM21%202H2V21H0V0H21V2Z'%20fill='%230071CE'/%3e%3c/g%3e%3cdefs%3e%3cclipPath%20id='clip0_676_40052'%3e%3crect%20width='24'%20height='24'%20fill='white'/%3e%3c/clipPath%3e%3c/defs%3e%3c/svg%3e)


