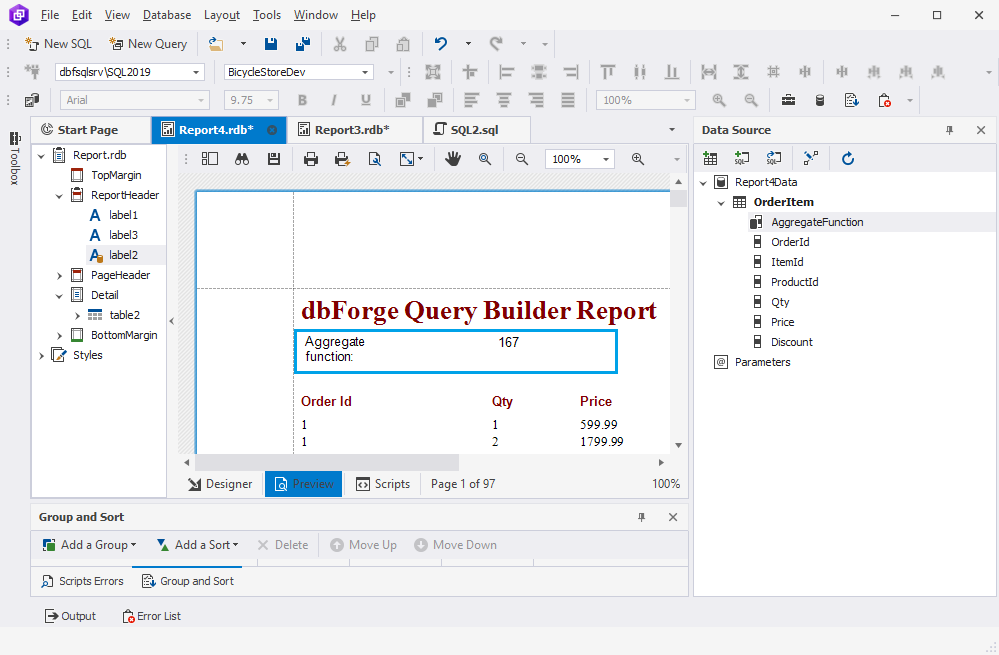
How to create a report with aggregate functions
The tutorial describes how to create a report with an aggregate function that will be added to the report by using a calculated field.
A calculated field is a calculation of column values based on a certain condition. They enables you to use complex expressions for specific data fields.
Report Designer supports the following aggregate functions:
| Name | Description |
|---|---|
| Avg | Returns an average value of all Expression values in the Collection based on the specified condition. |
| Count | Returns the number of entries in the Collection based on the specified condition. |
| Exists | Defines if the specified condition takes true for the specified Collection. |
| Max | Returns the maximum Expression value in the specified collection based on the specified condition. |
| Min | Returns the minimum Expression value in the specified collection based on the specified condition. |
| Single | Returns the Expression if the Collection contains only one object matching the specified condition. |
| Sum | Returns the sum of all the Expression values in the collection based on the specified condition. |
The syntax is as follows:
[Collection][Condition].AggregateFunction(Expression)
- Collection: Name of the collection against which an aggregated value will be calculated. If you leave square brackets empty, the root collection will be used.
- Condition: Combination of one or several expressions.
- Expression: Combination of one or several values to be used in the calculation.
Note
Aggregate functions can be applied to the Text, Label, and Table controls in the data-bound report.
Create a report with an aggregate function
In this example, we will calculate the Count() aggregate function. The report will display a total number of records where the price is higher than 449.
1. On the Database menu, click Report Designer.
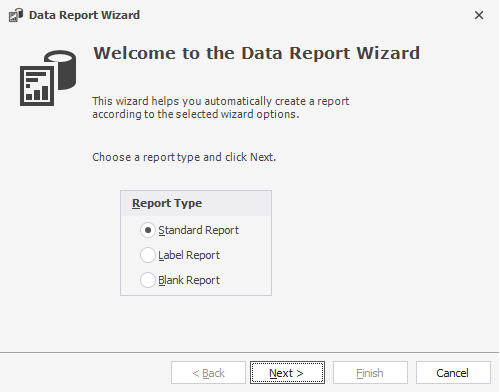
2. In the Data Report Wizard that opens, select the type of the report and click Next. In our case, it is a Standard Report.
3. Choose a database connection and Simple Table/View as a data type. Then, click Next.
4. On the Choose the table or view page, select the table from which you want to add columns to the report and click Next.
5. On the Choose columns to display in your report page, select the columns to be added to the report and click Next.
6. On the next pages, adjust the layout of the report and click Finish.
7. In the Data Source pane, right-click the data table and select Add Calculated Field.
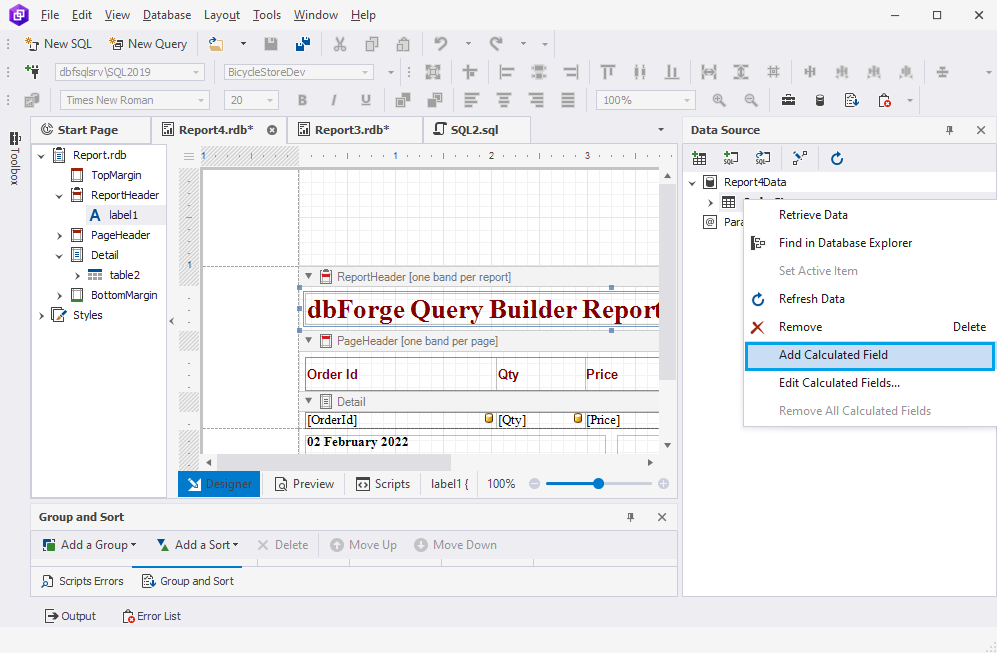
The calculated field will be created and displayed under the data table.
8. Right-click the calculated field and select Edit Calculated Field to set the properties.
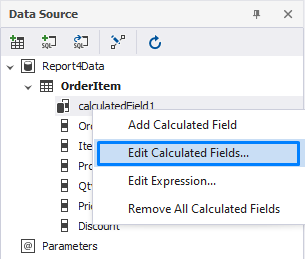
9. In the Calculated Field Collection Editor, set the properties of the calculated field such as a data source, a field type, and a name. Then, click OK to appy the changes.
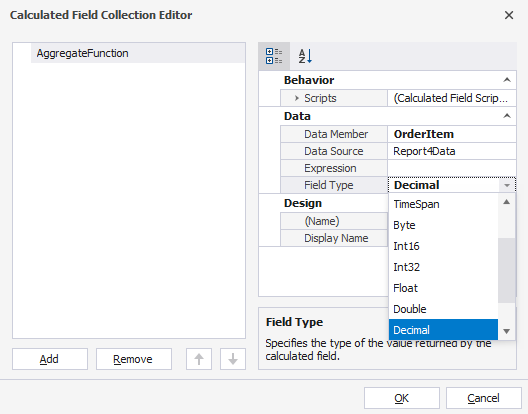
10. Drag the calculated field to the report.
11. Open the smart tag menu and click ![]() More options in the Expression field to add an aggregate function.
More options in the Expression field to add an aggregate function.
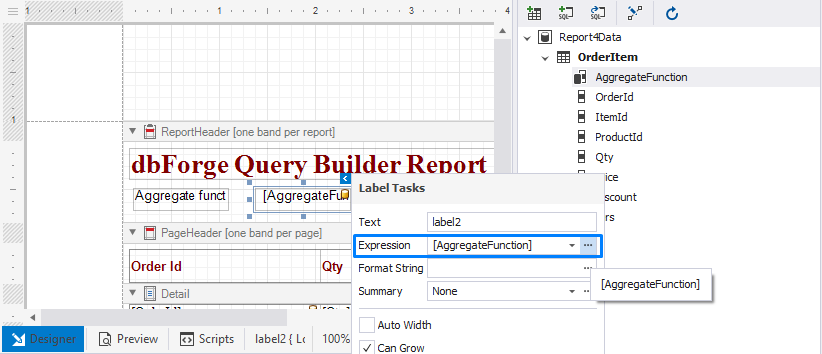
12. In the Expression Editor that opens, choose Functions > Aggregate and double-click Count. In the editor, enter the expression and click OK.

13. Switch to the Preview view to see the result.
