How to create a cross-tab report
A cross-tab report (also known as a pivot table) displays data in a tabular format, with the rows representing one set of data and the columns representing another set of data. It provides a compact and easy-to-read summary of data, making it useful for analysis and decision-making.
The guide explains how to create a cross-tab report using a Cross Tab control and a query as a data set. It provides two ways to bind a query to the report - the drag-and-drop functionality from Data Source or the Cross Tab Tasks window.
For the example, we’ll use the following SELECT statement as the data set.
SELECT
  YEAR(orders.order_date) AS year
 ,DATEPART(QUARTER, orders.order_date) AS quarter
 ,categories.category_name AS category
 ,brands.brand_name AS brand
 ,order_items.quantity * order_items.list_price AS order_total
FROM production.products
INNER JOIN production.brands
  ON products.brand_id = brands.brand_id
INNER JOIN production.categories
  ON products.category_id = categories.category_id
INNER JOIN sales.order_items
  ON order_items.product_id = products.product_id
INNER JOIN sales.orders
  ON order_items.order_id = orders.order_id
INNER JOIN sales.customers
  ON orders.customer_id = customers.customer_id
INNER JOIN sales.staffs
  ON orders.staff_id = staffs.staff_id
WHERE YEAR(orders.order_date) IN (2017, 2016)
AND brands.brand_name IN ('Trek', 'Surly')
AND categories.category_name IN ('Cyclocross Bicycles', 'Mountain Bikes', 'Electric Bikes');
In the output, the statement returns the flat data which makes it difficult to draw conclusions or make decisions based on the information.
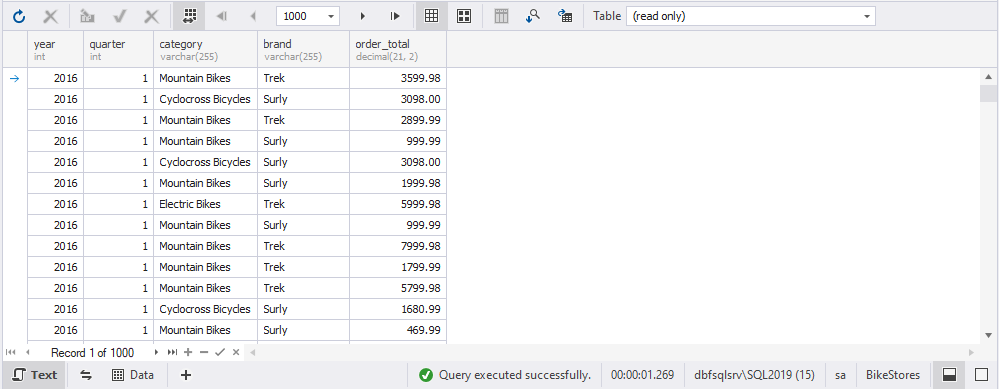
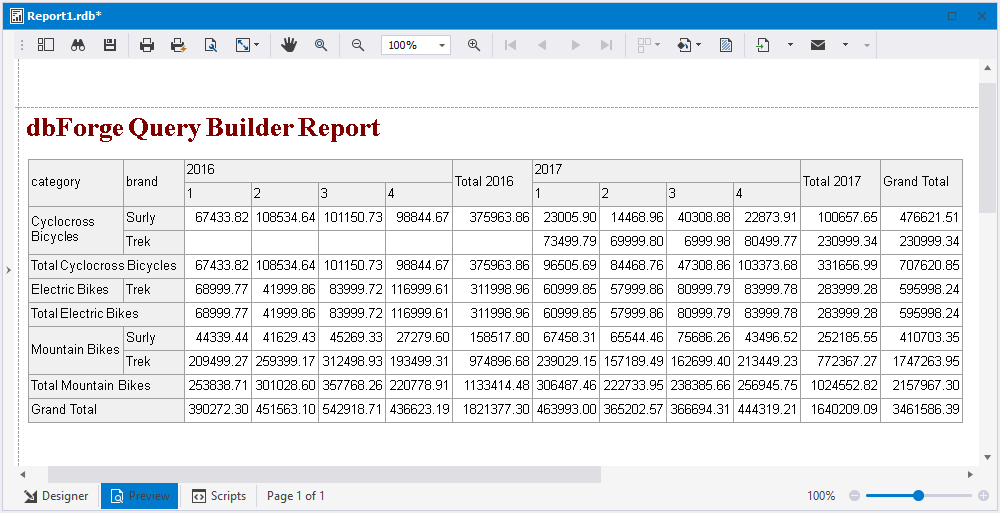
To make the data more manageable and useful, we will create a cross-tab report as a pivot table for bicycle sales in 2016-2017. In the report, the orders’ data will be grouped by year and quarter and sorted by brand and category. This will provide a clear and organized summary of the sales data that can be easily analyzed.
Create a cross-tab report
1. Go to File and select New > Blank Data Report.
2. In the Report Designer that opens, expand the ReportHeader band by moving its resize handles.
3. On the Report Designer toolbar, click ![]() Toolbox and drag the Cross Tab control to the ReportHeader band of the blank report.
Toolbox and drag the Cross Tab control to the ReportHeader band of the blank report.
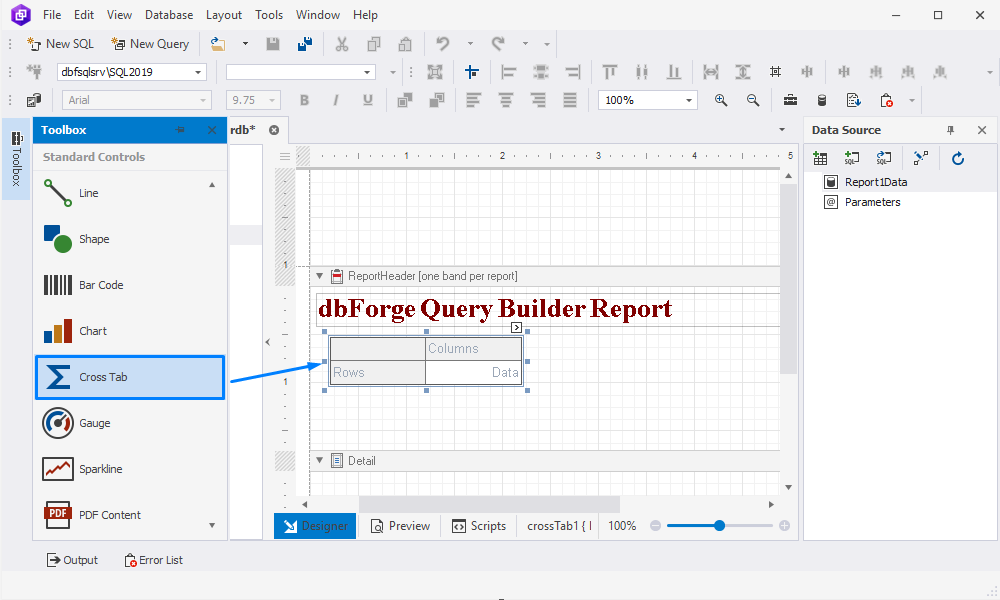
The Cross Tab control supports the following areas:
- Rows: Displays field values as row headers.
- Columns: Displays field values as column headers.
- Data: Calculates summaries of row and column fields.
Note
If you insert a Cross Tab control into the Detail band, the cross-tab data will be displayed for each record in the report’s record source.
4. Build a query to your cross-tab report. To do this, on the Data Source toolbar, click ![]() Add Query. In the Report.Query document that opens, switch to the Text view at the bottom of the document, insert a SQL query, and save the report.query.
Add Query. In the Report.Query document that opens, switch to the Text view at the bottom of the document, insert a SQL query, and save the report.query.
Then, go to the Report Designer document > Data Source pane. As you can see, the query with the fields is now displayed in the Data Source pane.
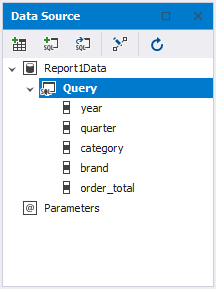
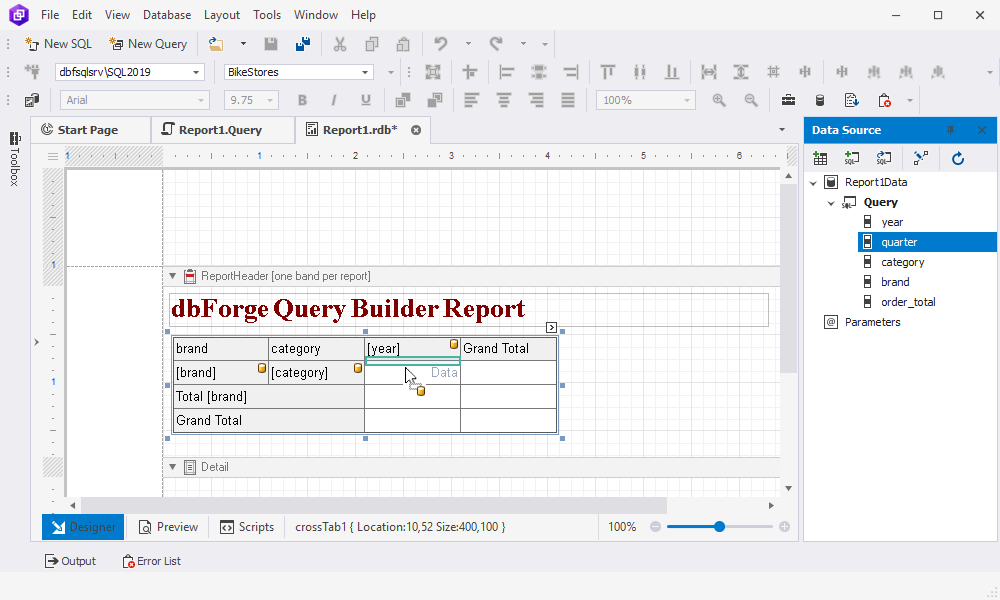
5. Under Data Source, drag the fields from Query to the corresponding cross-tab area on the ReportHeader band to define the layout.
To group the data by brand, drag the brand field onto the Rows cell. To further refine the grouping, drag the category field onto the cell border next to the Rows cell. This will group the data by category within each brand, providing a more detailed view of the sales data.
To display the sales data by year, drag the year field onto the Columns cell. Then, drag the quarter field onto the cell border below the year cell. This will group the data by quarter within each year, providing a more granular view of the sales data.
Finally, to display the total orders for each combination of brand, category, year, and quarter, drag the order_total field onto the Data cell of the pivot table. This will show the total order amount for each intersection of brand, category, year, and quarter, providing a comprehensive view of the sales data.
Note
If you have data sources configured, you can also bind fields to data using the Cross Tab Tasks window. For more information, see Bind fields to data using the Cross Tab Tasks window.
8. Switch to the Preview tab to see the result.
Note
If the table does not fit in the report, you may need to adjust the scaling settings to ensure that the entire table is visible. To do this, click
and then selecting Fit to > OK on the Preview toolbar.
In addition to adjusting the scaling settings, you can also customize the appearance of the report and manage the way data is displayed using the Properties pane. For example, you can change the paper size and orientation by selecting Report from the dropdown and then selecting Landscape and A3.
Bind fields to data using the Cross Tab Tasks window
1. In the ReportHeader band, select the Cross Tab control and click ![]() Smart Tag to open the Cross Tab Tasks window
Smart Tag to open the Cross Tab Tasks window
2. In the Cross Tab Tasks window that opens, do the following:
-
In the Data Source field, select the data source - Report1Data.
-
In the Data Member field, select a query or a table that contains the data you want to use for the cross-tab report.

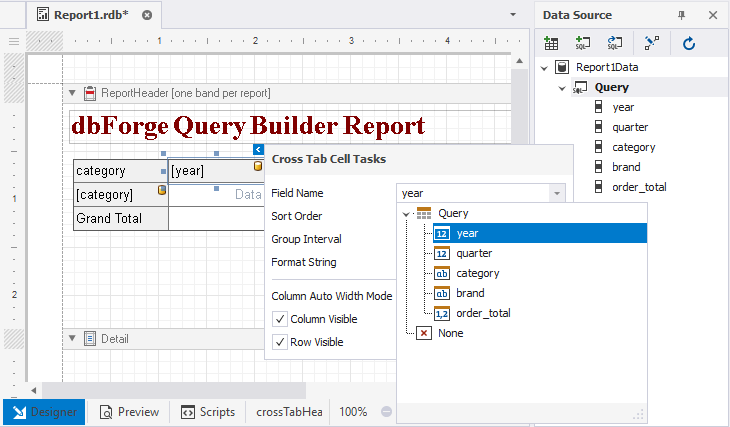
3. In the control, select the cell, click ![]() Smart Tag, and bind it to the data as follows:
Smart Tag, and bind it to the data as follows:
- Select Field name to bind this field to data from a query (or a table).
- Optional: Sort the values in ascending or descending order.
- Optional: Select a group interval to group values into categories.
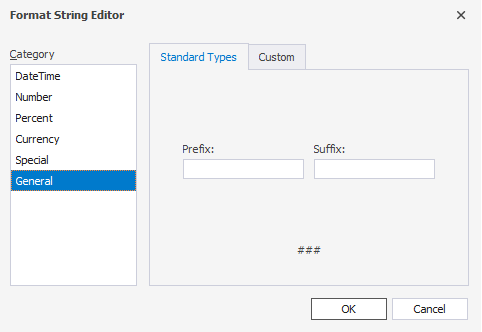
- Optional: In the Format String Editor, apply a format such as datetime, currency or percent, add a custom prefix or suffix for data-bound values. To open the editor, go to the FormatString field and click the ellipsis icon. In the editor that opens, set up formatting options and click OK.
- Optional: In the Column Auto Width Mode field, change the width of the cell.
- Make columns and rows either visible or invisible.
Note
To include multiple fields in the cell, use the drag-and-drop functionality as outlined in the Create a cross-tab report section. Then, go to the Cross Tab Tasks window: select the cell, click
Smart Tag, and adjust the values as necessary.
4. Repeat the same steps for each cell.
Furthermore, you can create a pivot table with the help of Report Designer. To learn how to do it, feel free to watch this video.