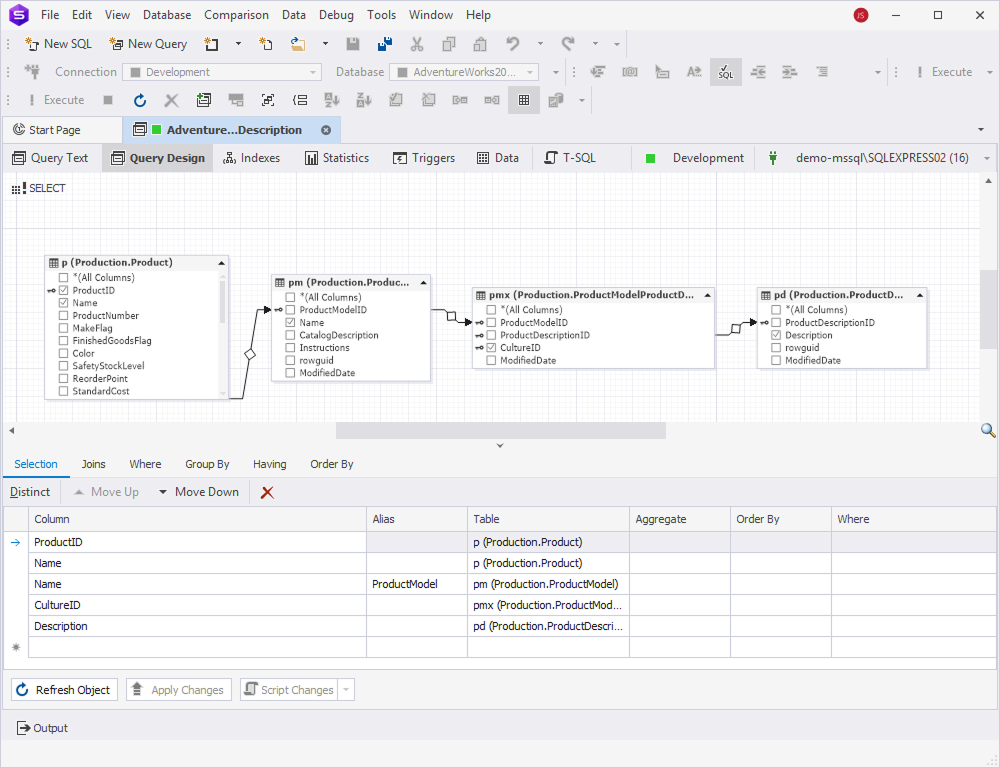
View Editor tab - Query Design
The Query Design tab allows you to graphically represent the query structure and relations between database objects on the diagram. The tab is divided into two sections – the diagram and Tabbed Editor.
Tabbed Editor includes the following tabs:
- Selection – Define selection criteria for one or more columns retrieved from tables.
- Joins – Create different types of JOINs, including INNER, LEFT OUTER, RIGHT OUTER, FULL OUTER, and CROSS JOINs.
- Where – Add, edit, or remove filtering conditions to retrieve records that meet specific conditions.
- Group By – Group rows with the same values based on one or more columns.
- Having – Specify a condition and condition groups combined with a logical operator.
- Order By – Sort results in ascending or descending order.
Selection tab
Add tables or views to a query
When you create a query, you retrieve data from tables or other structured objects, such as views.
To add an object to the diagram, do one of the following:
- From Database Explorer, drag the object onto the diagram.
- In Database Explorer, right-click the selected object and select Send to > Query Builder.
Tip: You can add multiple objects to the diagram. To do this, select the objects by holding Ctrl (for individual selection) or Shift (for a range).
Note
The database objects you add to the diagram and the Query Builder document must be connected to the same server.
Add an alias for the table
On the diagram, double-click the table header, enter the alias, and press Enter.
Remove tables from a query
To remove the table from the query, on the diagram, right-click the selected table you want to delete, and select Remove from Diagram.
To remove multiple objects at a time, select the objects by holding Ctrl, right-click them and select Remove from Diagram.
Add all columns to the query
To add all columns, do one of the following:
-
On the diagram, select the checkbox next to *(All Columns).
-
On the diagram, right-click the selected object and select Select all columns.
-
On the Query toolbar, select
 Select all columns.
Note
Ensure that no JOIN lines are selected on the diagram.
Add specific columns to the query
You can add columns on the diagram or in Tabbed Editor.
To add columns on the diagram, select the checkboxes next to the columns you want to add.
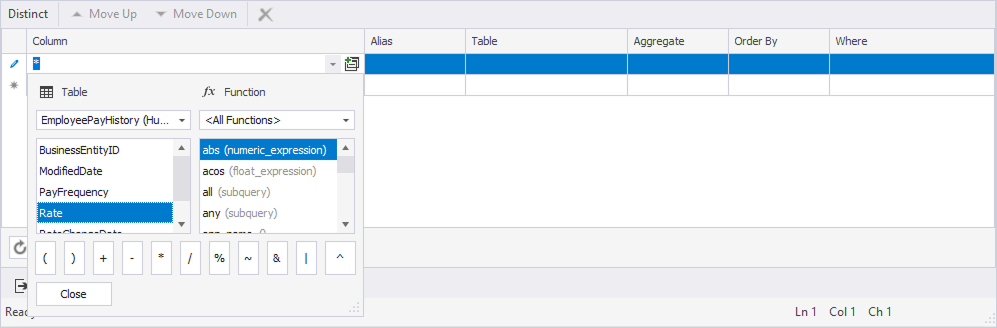
To add columns in Tabbed Editor:
1. Navigate to the Selection tab.
2. In the Column column, select the arrow.
3. In the Table and Functions window that appears, do the following:
- Under Table, select the table whose column you want to add.
- Double-click the column you want to add.
4. Optional: To add the function to the column, double-click the corresponding function from the list.
5. Optional: To add the operator to the expression, double-click the operator from the window.
6. Optional: To add an alias, in the Alias column, specify the alias for a table column.
7. Optional: To add an aggregate function, in the Aggregate column, select the aggregate function for the column.
The list of available aggregate functions is as follows:
| Name | Description |
|---|---|
| avg | Calculates the average amount for the selected values in the column. |
| binary_checksum | Returns the checksum as a binary value for a row or specific columns of the table. |
| checksum_agg | Returns the checksum of the values in a table as an integer. |
| count | Counts the total amount of rows in a specific column. |
| count_big | Counts the number of items in the SELECT statement as a big integer data type, including NULL and duplicate values. |
| grouping | Calculates the values in the group of the column in the SELECT statement. |
| grouping_id | Calculates the level of grouping. |
| max | Returns the highest value in a specific column. |
| min | Returns the lowest value in a specific column. |
| stdev | Calculates the standard deviation for all values retrieved in the SELECT statement. |
| stdevp | Calculates the standard deviation for all values in the expression based on the entire data population. |
| sum | Returns the sum of all NON-NULL values in a specific column. |
| var | Returns the variance of all variables in the SELECT statement. |
| varp | Returns the variance of all variables in the SELECT statement based on the entire data population. |
8. Optional: To arrange the column order, in the Order column, specify the order of values in the column.
9. Optional: To set a condition, in the Where column, enter the criteria based on which the data in the column will be filtered.
Remove columns from the query
To remove columns, do one of the following:
-
On the diagram, clear the checkbox next to the column you want to remove.
-
On the Selection tab of Tabbed Editor, select the column and select
 Remove on the Tabbed Editor toolbar.
Remove all columns from the query
To remove columns in bulk, on the diagram, right-click the selected table whose columns you want to remove and select Unselect all columns.
Joins tab
Add JOINs
You can add a JOIN between two tables on the diagram or on the Joins tab of Tabbed Editor.
To add a JOIN on the diagram, drag a column from the source table to the column from the target table.
Note
JOINs are automatically created when you add a table with a foreign key and its referenced table to the diagram.
To add a JOIN in Tabbed Editor, follow the steps in How to make joins between tables.
Where tab
Set up filtering conditions
To set up a filtering expression or relation between tables, use the WHERE or HAVING clauses in Tabbed Editor. For instructions, see How to build WHERE or HAVING clauses.
Group by and Order by tabs
Group and sort data
To group and sort data by specific columns, use the GROUP BY and ORDER BY clauses in Tabbed Editor. For instructions, see Include fields in GROUP BY or ORDER BY clauses.
Save changes
An asterisk (*) in the object name on the tab title indicates unsaved changes. To save and apply them, select Apply Changes.
Refresh the view
To update the view to reflect the latest changes, on the View Editor toolbar, select Refresh Object.
Generate a SQL script
To generate a SQL script:
1. On the View Editor toolbar, select the Show Script Changes arrow in the Script Changes list.
2. To open the generated script in a new SQL document, select To New SQL Window.
Alternatively, press Shift+Alt+C.
3. To copy the generated script to the clipboard, select To Clipboard.
This script allows you to review, modify, or execute the script manually instead of applying changes immediately.