How to manage Pivot Table data
dbForge Query Builder contains a powerful Pivot Table functionality for analyzing and visualizing large amounts of data. Let’s look at how you can manipulate data in a pivot table.
Pivot Table Properties
In the Properties window, you can manage the data display: change the cell format and specify how to apply it. The Properties window contents depends on the data type of the column selected in Data Source.
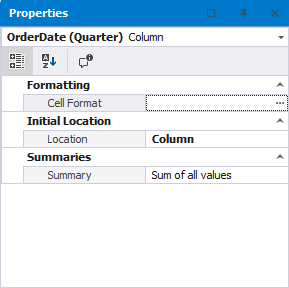
For the date datatype columns, the window looks like this.

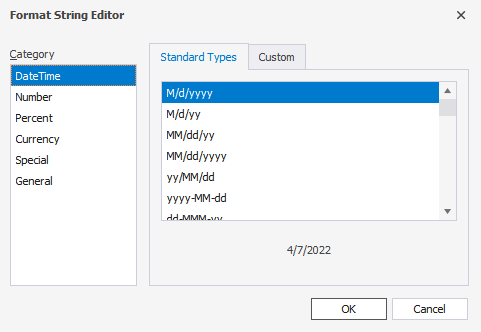
In it, you can easily change the format of a cell and specify how the formatting should be applied. To change the cell format, click … in the Cell format box, then in the Format String Editor that will appear, select the required format, and click OK.

In the Location drop-down, select how the cell formatting should applied. The available options are as follows: Row, Column, Data, Filter, None. When you select Column, cell formatting will be applied to all fields in that column. If you select Rows, the column data will be transposed to rows. When Data is selected, the column data will displayed in a grid. And in case None is selected, that column data won’t be displayed at all.
In the Summary drop-down, you can select to apply the chosen cell format for the aggregation functions: Sum of values, Average of values, Count of values, Maximum value, Minimum value, Standard deviation (Counted over a subset), Standard deviation (Over entire data), Population variance (Counted over a subset), Population variance (Over entire data). For example, if you select Maximum value, formatting will be applied only to the cell containing the maximum value.
Quick links
For more information on managing pivot data, please follow our step-by-step guides on how to sort, group, filter, and reorder data in pivot tables using the Query Builder tool:
How to sort and group pivot data