Overview of a pivot table
A pivot table is a powerful data analysis tool that converts large amounts of data into a compact and informative summary to calculate, summarize, and analyze data that lets you see comparisons, patterns, and trends in your data.
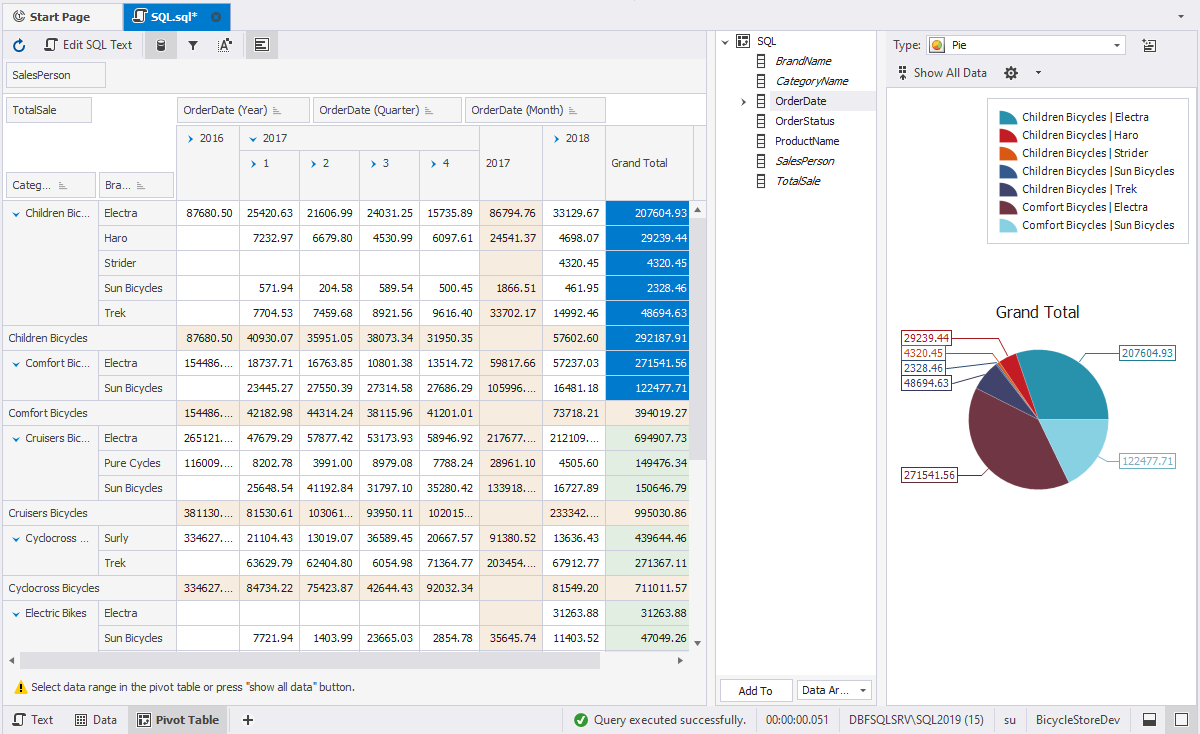
With the Pivot Table tool, you don’t need to go into SQL subtleties to group and summarize your data. Visual Pivot Table Designer, advanced filtering, visual data presentation in a graph make your data easier to read, understand and analyze. You can create a SQL summary report, analyze statistic information on the basis of a certain criterion, see the graphic interpretation of a SQL Server report, output summary information, etc.
The Pivot Table feature simplifies the aggregation process, statistical information count, and helps analyze data much easier and flexibly. The obtained report can be printed out, exported to various document formats, and sent by email in the required format with one click.
Also, if you want to create pivot tables withhout coding, feel free to watch this video.
Quick links
For more detailed information, please follow: