Types of fields in a pivot table
A pivot table enables you to analyze and summarize large volumes of data in the quickest way. You can modify pivot tables layout by adding the following data source fields:
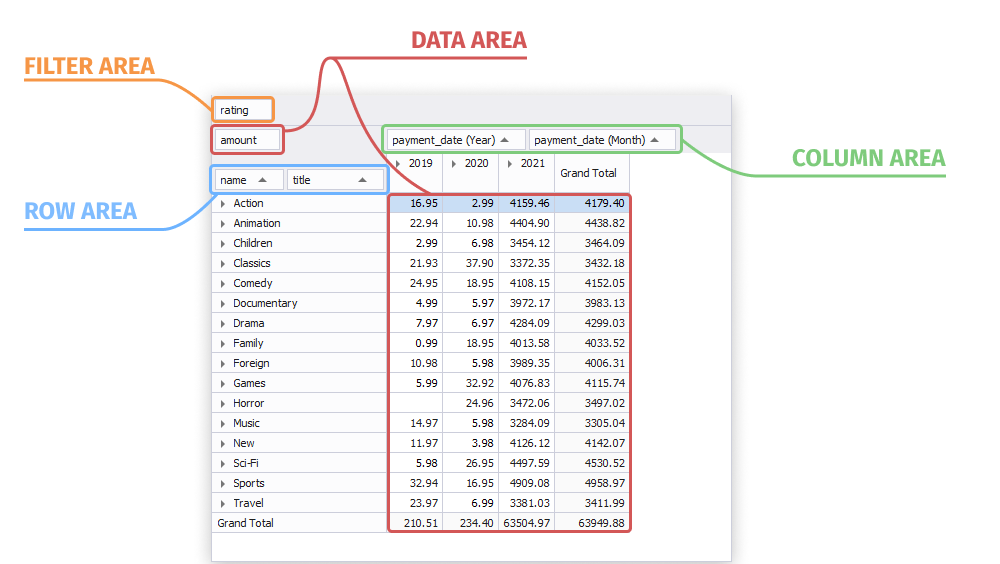
To convert your data into a pivot table, you can drag data source fields into four areas in the Pivot Grid view of the SQL document. They are the following:
- Filter area displays a data source field as a filter field.
- Row area displays a data source field as a row field.
- Column area displays a data source field as a column field.
- Data area displays values of the data field that you drag from the Data Source view, total and grand total values that are automatically calculated after adding the fields to this area, and any custom summary calculations you can select for the fields.
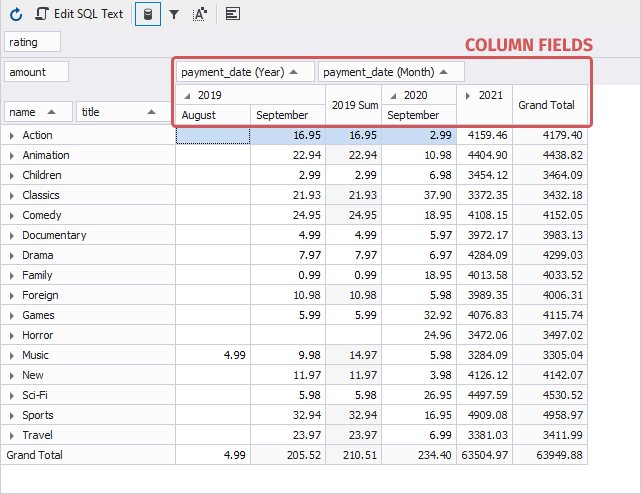
Headers
Headers are part of fields that can be added to a pivot table in the Pivot Grid view of the SQL document. They let you to manage data of the fields in different ways. You can sort, filter, move the field headers to any pivot table area to rearrange the data and get the best layout to understand the data relations and dependencies.
You can see the headers for the filter, column, row, and data fields.
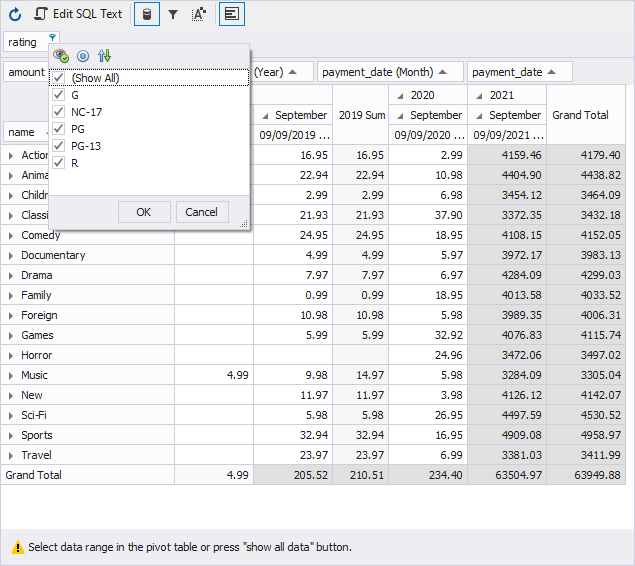
Filter field
A filter field is a data source field that you place into the filter field area in the Pivot Table view of the SQL document. It allows you to filter all the data in a pivot table by applying custom filtering criteria.
To add a filter field, drag a required field from the Data Source view. To set filter criteria, click Filter in the filter field, and select the criteria from the drop-down dialog box.
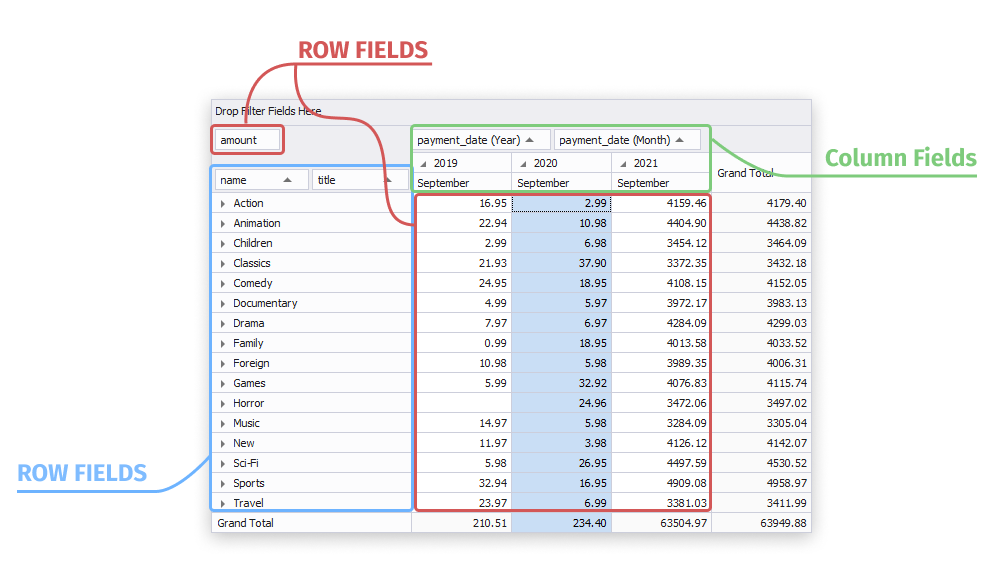
Row field
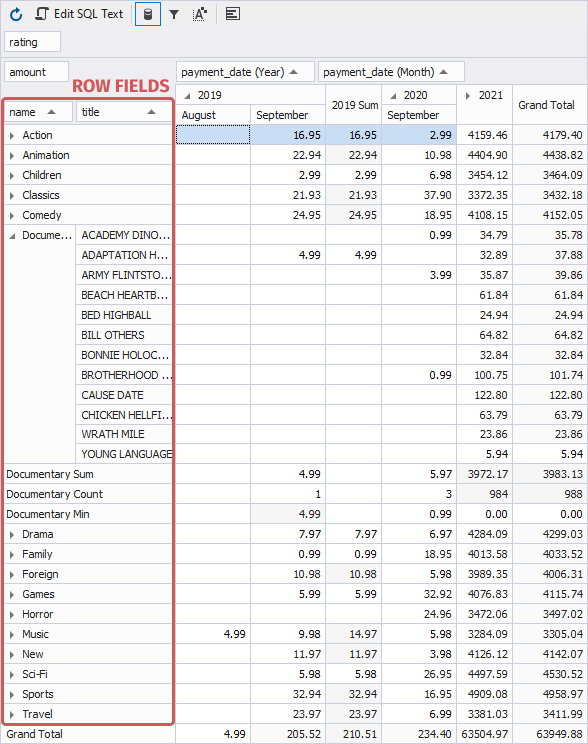
A row field is a data source field that you place into the row field header area in the Pivot Table view of the SQL document. It consists of a row header and values. A row header displays a row name and allows you to sort and filter row data, move the column to any pivot table area to rearrange the data.
To add a row field, drag a required field from the Data Source view. You can add multiple row fields. In this case, the values of the leftmost column field will be displayed only once, as the values of other row fields will be repeated.
Data field
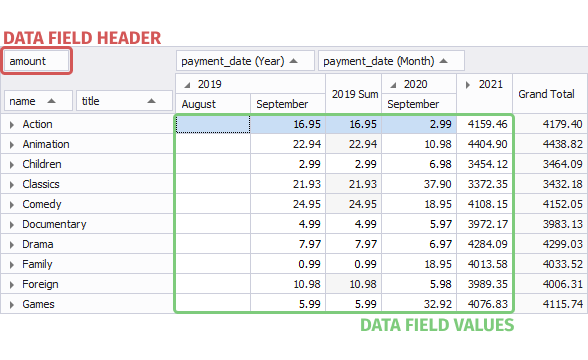
A data field is a data source field that you place into the data area in the Pivot Grid view of the SQL document. To add a data field, drag a required field from the Data Source view. The sum of data field values as well as grand total values are automatically calculated and displayed in a pivot table.
You can select the following summary calculation functions to apply for data fields:
- Sum
- Average
- Count
- Min, Max
- Standard deviation based upon the entire data or the subset
- Population Variance based upon the entire data or the subset
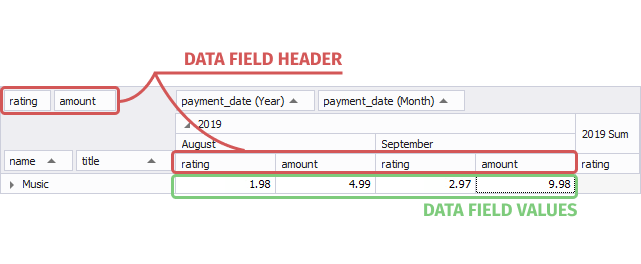
Data fields consist of a header and values. The header contains a data field name, which helps you identify the values of the data fields.
Column field
A column field is a data source field that you place into the column field area in the Pivot Grid view of the SQL document. It consists of a column header and values. A column header displays a column name and allows you to sort and filter column data, move the column to any pivot table area to rearrange the data.
To add a column field, drag a required field from the Data Source view. You can add more than one column field. In this case, the values of the leftmost column field will be displayed only once, as the values of other column fields will be repeated.