Totals and grand totals in Pivot Tables
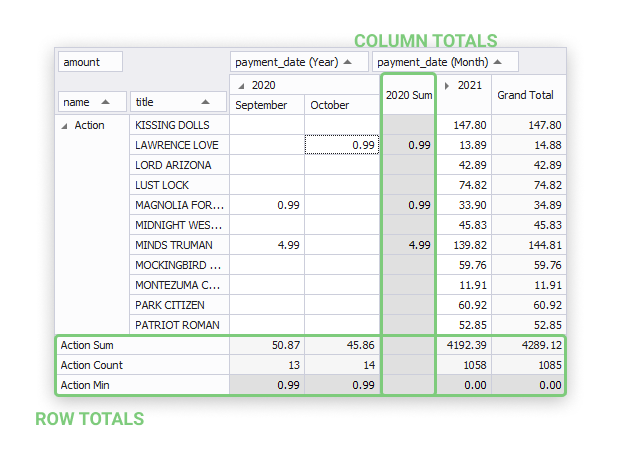
The Pivot Table feature offers you a number of summary functions that you can apply to the required column or row fields to calculate custom totals for their values. Custom totals are displayed in additional rows or columns highlighted with the grey color. The summary functions are applied only to those fields that summarize the data of another field, for example, data of the category name field summarizes data of the film title field. The default function calculates the sum of all values, so you can see the Sum values just after adding row and column fields in a pivot table. You can cancel the default function or, quite the contrary, add others.
Totals
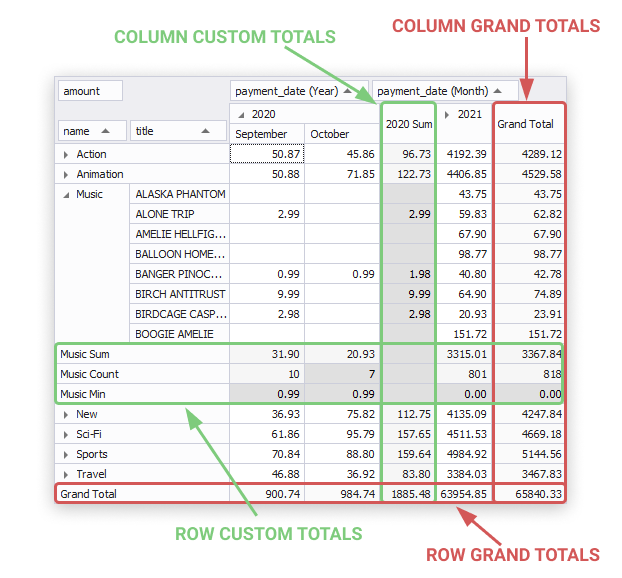
Row totals are the rows containing a calculated sum of row field values. Column totals are the columns containing a calculated sum of column field values.
Totals are calculated based on the selected summary functions and displayed in the Data area highlighted with the gray color. The default function calculates the sum of all values. You can cancel the default function or, quite the contrary, add others.

Grand totals
Row grand totals are rows containing an automatically calculated sum of row field totals. The Grand Totals columns are columns containing an automatically calculated sum of column field totals.
Grand Totals are displayed in the data area highlighted with the light yellow color when you add any data fields to the Row Fields, Column Fields, and the Data area in the Pivot Grid view of the SQL document.
Besides automatic grand total values, you can get custom totals for a required field. They are calculated based on the selected summary functions.

How to calculate custom totals
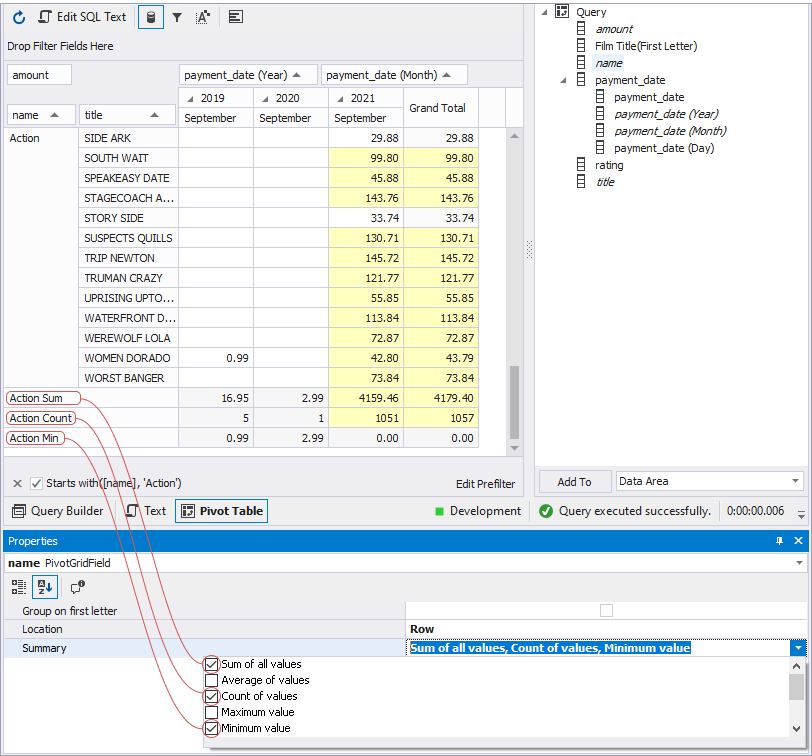
To calculate a summary function
1. In the Data Source view, select a required field and go to the Properties window. To open it, right-click the field and select Properties from the shortcut menu.
2. Click the Summary field and select a required function or several ones to apply. See the custom totals in a pivot table.
