Walkthrough on how to create a pivot table
This topic provides a detailed worked example on how to create a pivot table and analyze data with its help. We will query the BicycleStore database and on the concrete example demonstrate you how to:
- Group data by year, quarter, category, and brands.
- Filter total sales by a specific salesperson.
- See how many bicycles were sold during the first six months.
- Display data where the values of total sales are higher than 1000.
- Highlight total sales that are less than 2000 and higher than 4000.
- Build a chart for the created pivot table.
Prerequisites
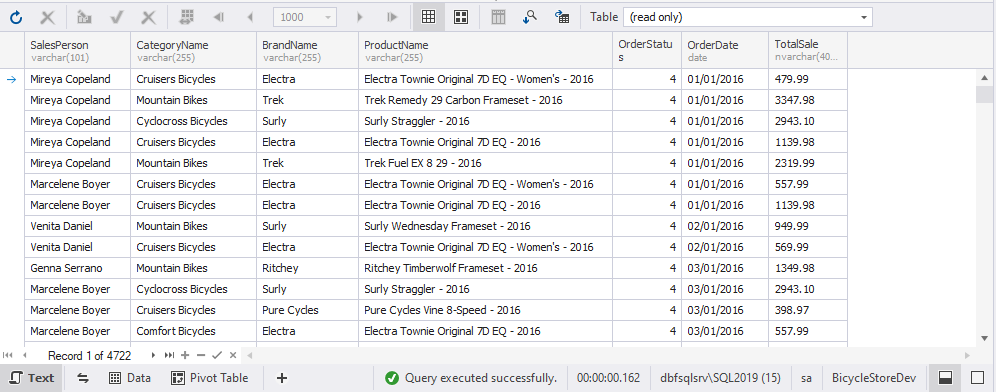
We will use the following SELECT query as an example. It returns total sales of bicycles grouped by categories, brands, vendors. Also, the result grid outputs their order status and dates.
SELECT
CONCAT(Staff.FirstName, ' ', Staff.LastName) AS SalesPerson,
c.CategoryName, b.BrandName, p.ProductName, o.OrderStatus, o.OrderDate,
FORMAT(oi.Qty * oi.Price - oi.Qty * oi.Price * oi.Discount, '0.#0') AS TotalSale
FROM Sales.OrderItem oi
     INNER JOIN
     Sales.[Order] o
     ON oi.OrderId = o.OrderId
     INNER JOIN
     Production.Product p
     ON oi.ProductId = p.ProductId
     INNER JOIN
     Production.Brand b
     ON p.BrandId = b.BrandId
     INNER JOIN
     Production.Category c
     ON p.CategoryId = c.CategoryId
     INNER JOIN
     Sales.Staff
     ON o.StaffId = Staff.StaffId
Before creating a pivot table, note that:
- You should connect a pivot table to the data you want to display and rearrange it in the pivot table. The data source can be a query in the SQL or query document.
- Not all the data source tables are good for converting into a pivot table. The data source should contain a column with duplicated values, which can be grouped, and a column with numeric data, which can be used to calculate grand totals and custom totals.
- You should place data source fields from the Data Source view into the pivot table areas to add the data to the pivot table.
To create a pivot table
1. On the File main menu, select New > Pivot Table.
2. At the bottom of the Pivot Table view, click ![]() Open document view, select Text, and enter the SQL script from the prerequisites.
Open document view, select Text, and enter the SQL script from the prerequisites.
3. On the Pivot Table view, refresh the data to view the data source, which will be used to bind table data to the columns and rows of the pivot table.
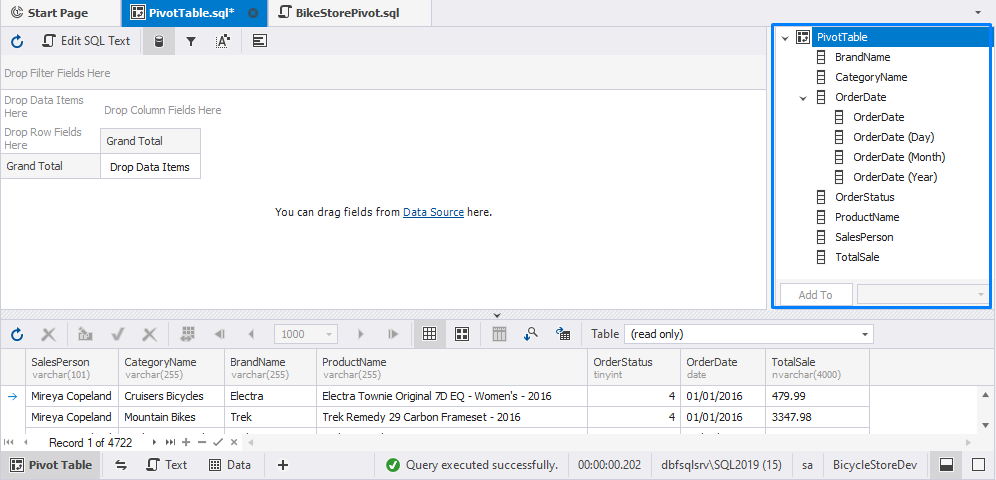
Note
Any field with the date or time data format is decomposed in the Data Source view to its components. For more information about the fields in a pivot table, follow Types of fields in a pivot table.
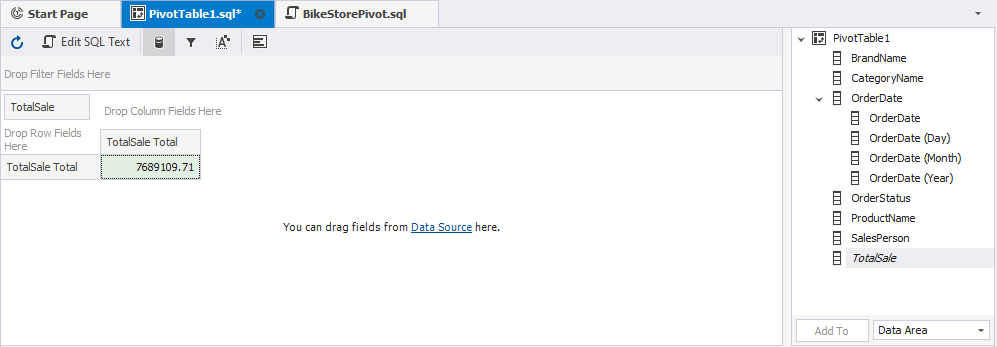
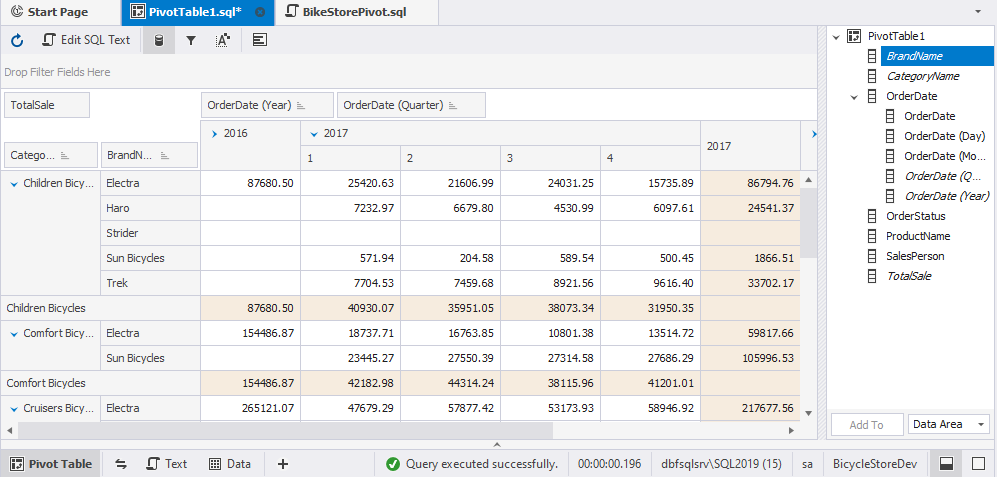
4. To add fields to the pivot table, drag them from the Data Source pane to a required pivot table area:
- TotalSale to Drop Data Items. It will calculate the total sum of all sales (from the TotalSale column) for all dates and done by all salespeople.
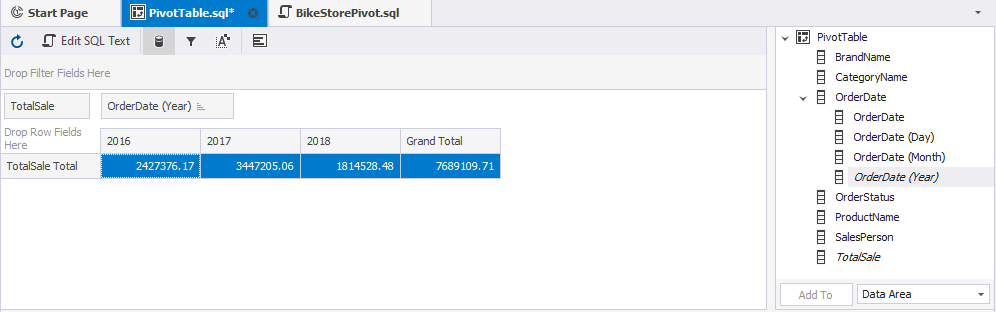
- OrderDate (year) to Drop Column Fields. It will display sales by year.
5. In the Data Source pane, right-click the OrderDate node and select Group by > Quarter to group total sales by a quarter.
6. To group data by categories and brands, drag CategoryName and BrandName from the Data Source pane to Drop Row Fields.
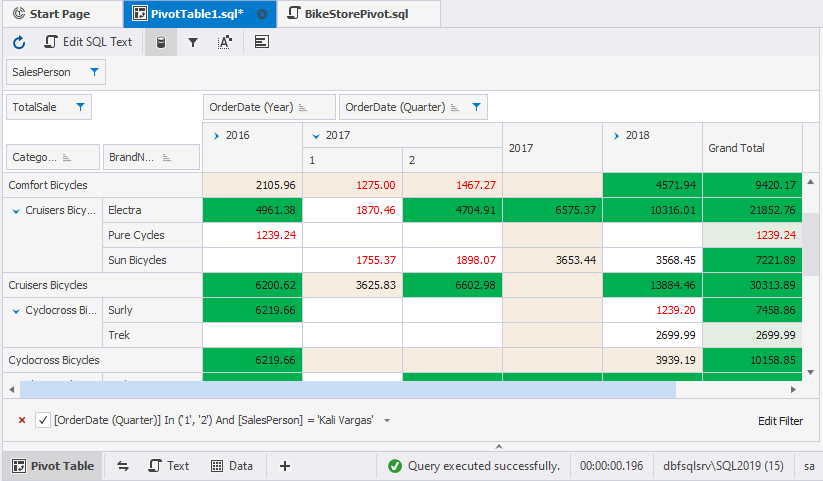
7. As a result, the pivot table contains total sales data for all salespeople. In addition, total sales are grouped by quarters, categories, and brands and the following:
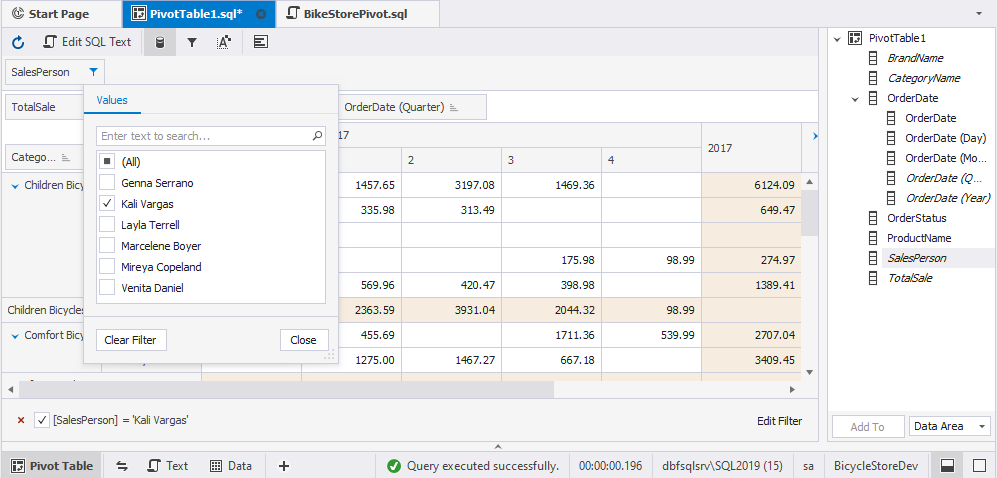
8. Now, let’s filter data by a specific salesperson. To do so, drag SalesPerson from the Data Source pane to Drop Filter Fields. Then, click ![]() Filter and select the checkbox next to the salesperson whose sales data you want to display.
Filter and select the checkbox next to the salesperson whose sales data you want to display.
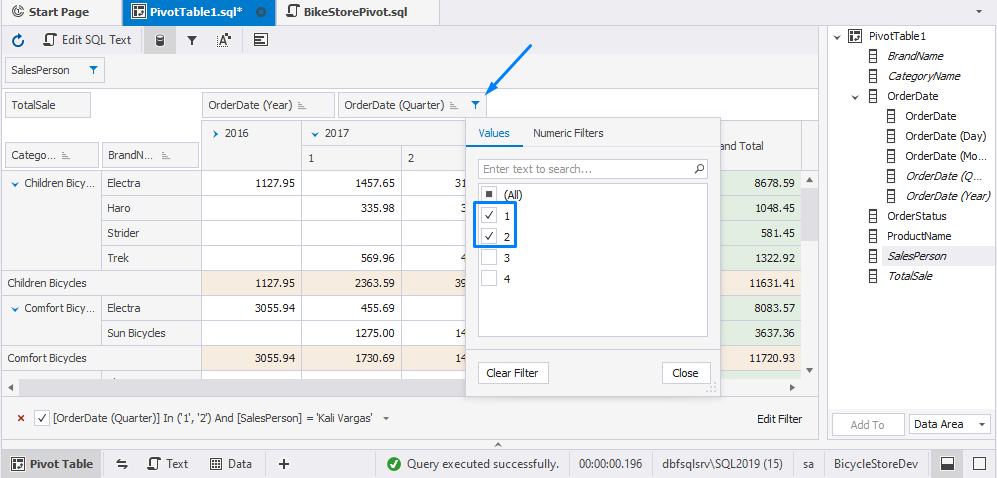
Or we can also view how many bicycles were sold during the first six months. To do so, click ![]() Filter on the header of the OrderDate (Quarter) control and select the 1 and 2 checkboxes.
Filter on the header of the OrderDate (Quarter) control and select the 1 and 2 checkboxes.
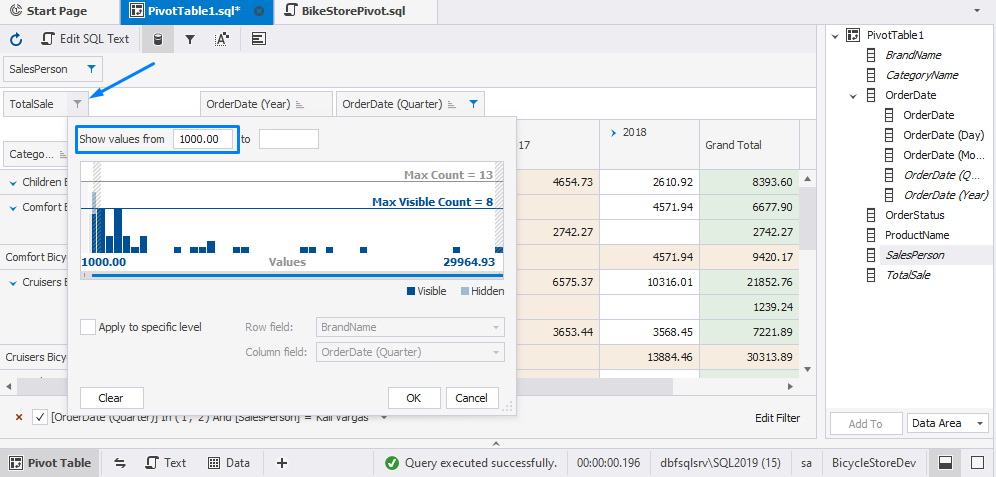
9. Next, we are going to display total sales that have values higher than 1000. To do so, click ![]() Filter on the header of the TotalSale control, enter 1000 in the Show values from field, and then click OK.
Filter on the header of the TotalSale control, enter 1000 in the Show values from field, and then click OK.
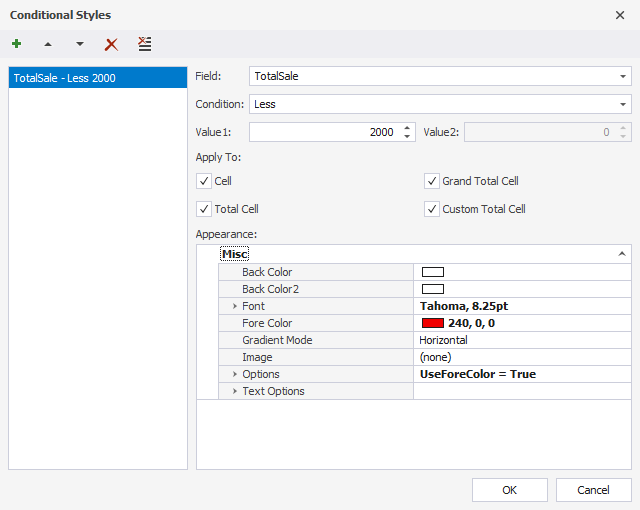
10. Now, let’s highlight total sales values that are less than 2000. This can be done with the help of the Conditional Styles functionality.
To apply conditional styles, do the following:
- On the Pivot Table toolbar, click
 Conditional Styles or right-click the pivot table header or cell and select Conditional Styles on the shortcut menu.
 - In the dialog that opens, click Add to add a new condition.
- From the Field dropdown list, select TotalSale.
- From the Condition dropdown list, select Less.
- In the Value1 field, enter 2000.
- In the Appearance section, click the Fore Color field and select the red color to highlight the values.
- Click OK to apply the changes.
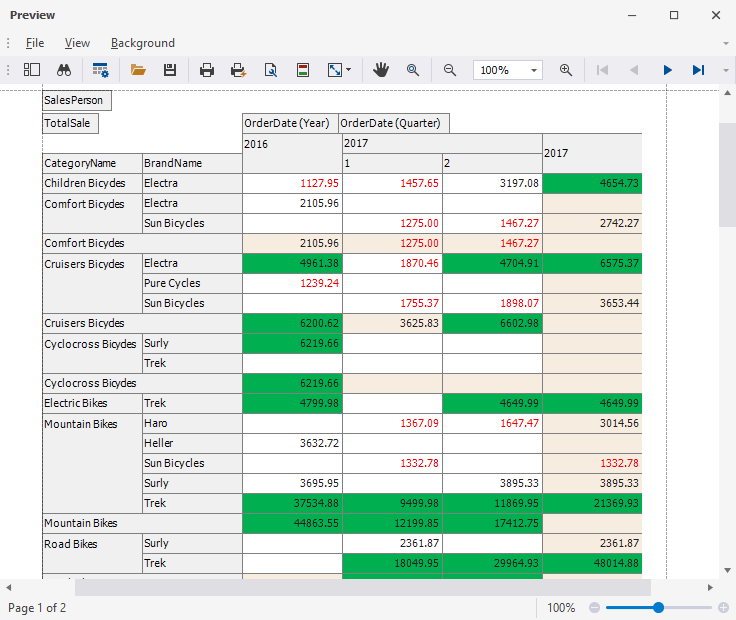
In addition, we want to highlight values where total sales are higher than 4000. In this case, open the Conditional Styles dialog and add another conditional style by following the abovementioned steps. However, choose the green color in the Back Color field instead of the Fore Color field.
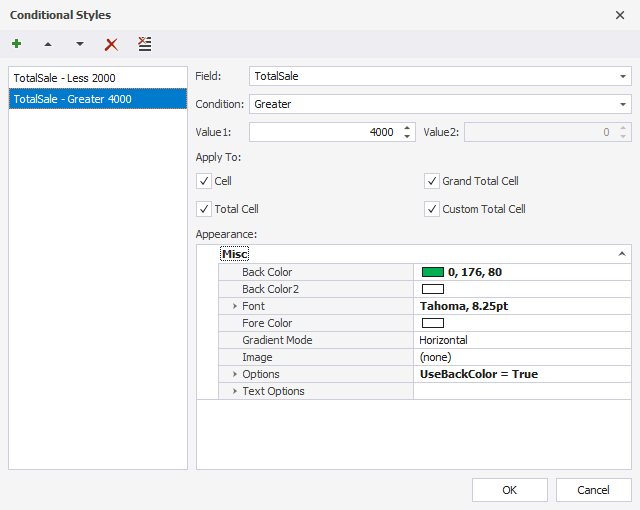
Once done, see the result.
To learn more about conditional formatting in a pivot table, see How to apply conditional styles.
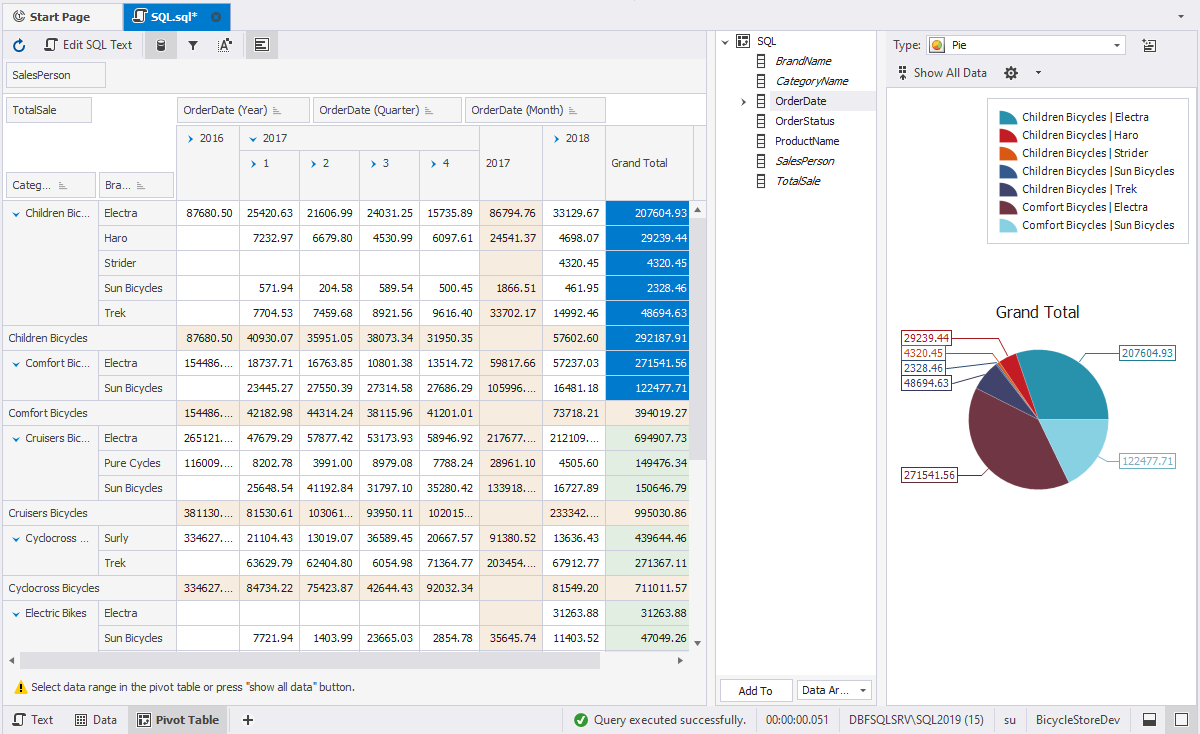
11. Now, build a chart for the pivot table to analyze the sales visually. On the Pivot Table toolbar, click ![]() Show Chart and do the following in the Chart pane that opens:
Show Chart and do the following in the Chart pane that opens:
- Select Pie as a type.
- In the pivot table, select the cells of the Grand Total column by the category Mountain Bikes.
After we have created the pivot table, we can preview it: On the File menu, click Print. For more information, see Previewing a pivot table.
Quick links
For more detailed information, please follow: