How to debug a stored function
The guide provides a step-by-step procedure for debugging a stored function, illustrating various debugging techniques, such as setting breakpoints and viewing data items.
Prerequisite
For demo purposes, use the sample scripts to create a GetAbsenceCountByCode function within a TestScheduleDB database.
Debug the function
1. In Database Explorer, right-click the required database and select New SQL to open a SQL document.
2. Type the following SQL statement:
DECLARE @result INT;

SET @result = dbo.GetAbsenceCountByCode('Vacation');

SELECT @result AS VacationDays;
3. To start debugging, click ![]() or press F11 until a SQL document with the
or press F11 until a SQL document with the CREATE statement for the function opens.
Note
Ensure the Enable code completion feature is selected in Tools > Options > Text Editor > Code Completion > General.
4. Optional: To view the value of the variable, hover over it in the query.
The quick info tip will be displayed.
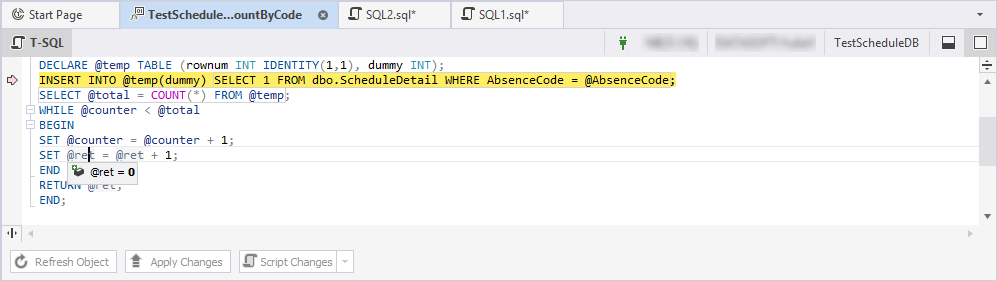
Note
The yellow arrow identifies the stack frame where the execution pointer is currently located.
5. To insert a breakpoint, do one of the following:
- Right-click the line of the code where you want to set a breakpoint and select Insert Breakpoint.
- Place the cursor on the line of the code you want to break on, navigate to the top menu, then select Debug > Toggle Breakpoint, or press F9.
- Click on the gray bar to the left of the code where you want to insert a breakpoint.
In SQL Editor, the line with the breakpoint will be highlighted in red.
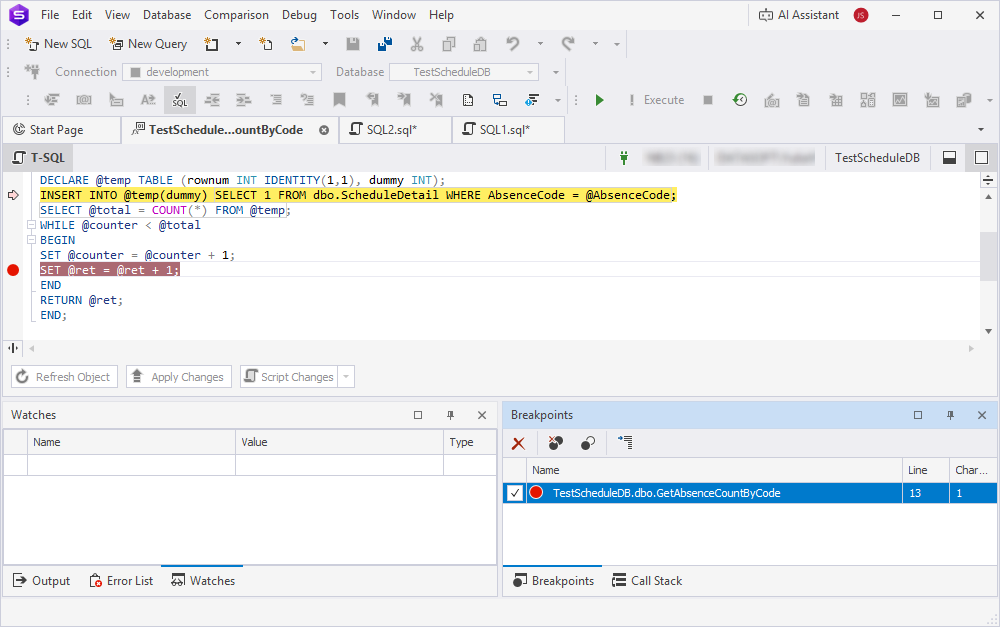
6. On the Debug toolbar, click ![]() or press Alt+F5.
or press Alt+F5.
The Breakpoints pane opens where you can view and manage breakpoints.
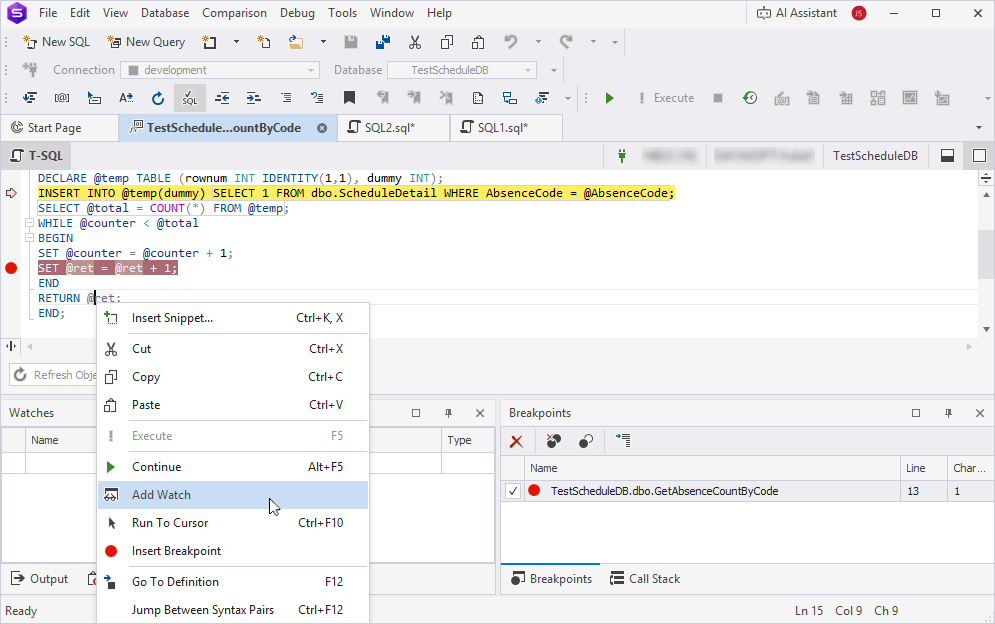
7. To add the variable to the Watches pane, right-click the variable, then select Add Watch.
8. On the Debug toolbar, click ![]() or press F11 repeatedly to step through the code.
or press F11 repeatedly to step through the code.
Note
You may ignore stepping into the function by clicking
. In this case, you will continue stepping through the function.
9. Step through the function until you go back to the function, and continue to the end.
Tip
You may get back to the function code by clicking
. In this case, you will continue stepping through the function.
To get back to the parent code, click the function in the Call Stack pane.
10. To stop debugging, do one of the following:
-
On the Debug menu, select Stop Debugging or press Shift+F5.
-
On the Debugger toolbar, click
 .
. -
On the Debugger toolbar, click
or press F10.