Operations with breakpoints
A breakpoint informs the Debugger to pause execution at a specific line of code. When execution breaks, you can use the Watches pane to evaluate variable values. The breakpoint stops execution at the line that is about to run next. The application remains in break mode until you select Step Into, Step Over, Step Out, or Run to Continue.
Note
Conditional breakpoints and hit-count breakpoints are not yet implemented.
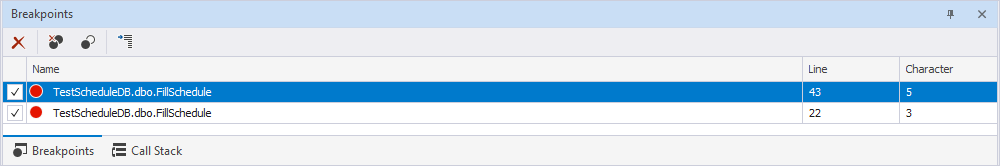
Breakpoints pane
The Breakpoints pane lists all breakpoints currently set in your code and shows their properties. From this pane, you can enable or disable breakpoints, delete them, or navigate to the related source code. The Debugger can’t manage breakpoints while the application is running. However, you can set breakpoints during run mode, and they will become active when the Debugger enters break mode.
Breakpoints toolbar
When you insert breakpoints, a toolbar appears allowing you to manage breakpoints.
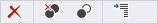
The following table provides options from the Breakpoints toolbar.
| Icon | Name | Description |
|---|---|---|
| Delete | Deletes the selected breakpoint. | |
| Delete All Breakpoints | Deletes all breakpoints inserted in the code you debug. | |
| Disable All Breakpoints | Temporarily deactivates all breakpoints in your code without removing them. | |
| Go To Source Code | Navigates you to the line of code in the source script where the selected breakpoint is set. |
Breakpoints grid
The following table explains the Breakpoints grid.
| Name | Description |
|---|---|
| Checkbox | Indicates a breakpoint status. When selected (default), the breakpoint is activated. |
| Name | Shows the location of the breakpoint: the database, schema, and object name, for example, a stored procedure. |
| Line | Shows the line number in the source code where the breakpoint is set. |
| Character | Displays the character position (column number) on that line. This helps pinpoint the exact location within the line. |
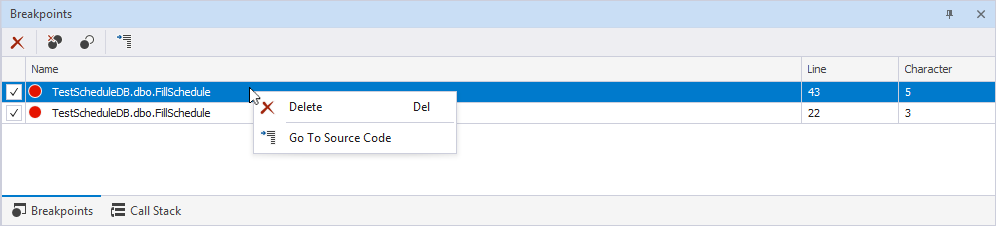
Use the shortcut menu to:
- Delete the selected breakpoint.
- Navigate to the source code of the selected breakpoint.
Breakpoint status
A breakpoint status is indicated by an icon that appears in the gray bar to the left of the statement. When the breakpoint is selected, the Debugger highlights the corresponding part of the statement. The breakpoint status can be:
- Enabled: The Debugger suspends execution at the specified breakpoint.
- Disabled: The Debugger ignores this breakpoint.
- Error: No breakpoint can be set at this location; the location is illegal, and the breakpoint cannot be bound. The Debugger ignores this breakpoint.
Insert a breakpoint
You can insert breakpoints using the shortcut menu and the Debug menu.
Insert from the shortcut menu
1. In a source window, right-click a line of executable code where you want to set a breakpoint.
2. On the shortcut menu, select Insert Breakpoint.
Insert from the Debug menu
1. In a source window, place the cursor on a line of executable code where you want to set a breakpoint.
2. In the top menu, select Debug > Toggle Breakpoint, or press F9.
Alternatively, in the gray bar to the left, select the line you want to break at and press F9.
After you insert a breakpoint, its icon appears in the gray bar to the left of the statement and in the Breakpoints pane.
Delete a breakpoint
To delete a breakpoint, do one of the following:
-
In the Breakpoints pane, select the breakpoint, then click
 .
. -
In the Breakpoints pane, right-click the breakpoint and select Delete.
-
In the gray bar to the left of the statement, click the breakpoint icon.
-
Place the cursor over the code line with the breakpoint (it is highlighted with red color) and on the top menu, select Debug > Toggle Breakpoint.
-
Right-click the code line with the breakpoint and select Delete Breakpoint.
Delete all breakpoints
To delete all breakpoints, do one of the following:
-
In the top menu, select Debug > Delete All Breakpoints.
-
In the Breakpoints pane, click
 .
.
Activate or deactivate a breakpoint
To activate a breakpoint, in the Breakpoints pane, select the checkbox next to the breakpoint you want to activate.
To deactivate a breakpoint, in the Breakpoints pane, clear the checkbox next to the breakpoint you want to deactivate.
Enable or disable all breakpoints
To enable or disable all breakpoints, in the Breakpoints pane, click ![]() .
.
Note
To disable all breakpoints, at least one breakpoint must be enabled. Otherwise, clicking
will enable all breakpoints.
Icon reference
The table describes the icons and their usage in the debugger.
| Icon | Description | Triggering event |
|---|---|---|
| A breakpoint is active. Execution pauses when this line is reached. |
Appears when you click the gray margin bar or select the Insert Breakpoint shortcut menu option. | |
| A breakpoint exists but is inactive, and the debugger ignores it during execution. | Appears when you click |
|
| The breakpoint is in a warning state, indicating it cannot be executed. | Appears when you try to set a breakpoint on a line that cannot be executed. | |
| Indicates the line of code currently being executed or shows the call stack location in the Call Stack pane. | Appears when execution is paused and helps you identify where the debugger is currently positioned. | |
| Execution stops at the breakpoint. | Appears when the debugger has paused on the line where the breakpoint is set. | |
| Execution stops at an inactive breakpoint. | Appears when execution reaches a line that contains an inactive breakpoint, and the debugger stops on that line but doesn’t pause execution at that point. | |
| Steps into the function that is called from the code currently being debugged. | Appears when the debugger is paused and marks the exact line of code that will run next when execution continues. It also appears when stepping through code (Step Into, Step Over, Step Out). |