Debugger overview
Debugger helps you monitor runtime behavior of your database objects and pinpoint logic errors. You can pause execution at any point, inspect database objects, and evaluate or modify variables directly within your script.
The dbForge Studio Debugger helps you perform several key tasks in debug mode:
Control code execution:
- Start or continue execution of procedures, functions, triggers, and SQL scripts.
- Step through code using the following options:
- Continue: Runs the code until it reaches the next breakpoint or the end of execution.
- Step into: Executes statements one at a time. If the line includes a function call, the Debugger enters the function and stops at its first line.
- Step over: Executes the current line and moves to the next one. Use this to skip over function calls without stepping into them.
- Step out: Exits the current function or stored procedure and returns to the calling code.
Manage breakpoints:
- Set breakpoints on executable lines of code to pause execution at specific points.
- Use the Breakpoints pane to view, enable, disable, delete, or navigate to breakpoints.
View execution results:
- Use the following panes to explore query output and debug information:
- Results and Messages panes: Show output from the previously executed statements.
- Output pane: Displays messages related to Debugger activity.
- Watches pane: Shows the current values and data types of server and session variables. Expressions with variables and constants, such as
@a - @bor@a - 1, are not supported. - Call Stack pane: Lists the active function or procedure calls. The yellow arrow indicates the current execution point.
Requirements for starting the Debugger
Before you run the Debugger, ensure the following requirements are met:
- Server-side and client-side components of T-SQL Debugger are installed.
- Firewall exceptions for debugging are enabled on both the client and server sides.
- The SQL document is connected to the Database Engine using Windows Authentication or SQL Server Authentication with a login that is a member of the sysadmin fixed server role.
- The SQL document is connected to a Database Engine instance of SQL Server 2005 SP2 or later. You cannot run the Debugger when the SQL document is connected to an instance in single-user mode.
Note
The Debugger does not work with the Microsoft cloud services like Azure SQL Database.
For more information, see Configure the Debugger.
Access the Debugger
To access the Debugger, use the Debug menu or Debug toolbar. Debugger windows and dialogs display information about database objects and let you enter additional details.
To get Help for the dialog, press F1.
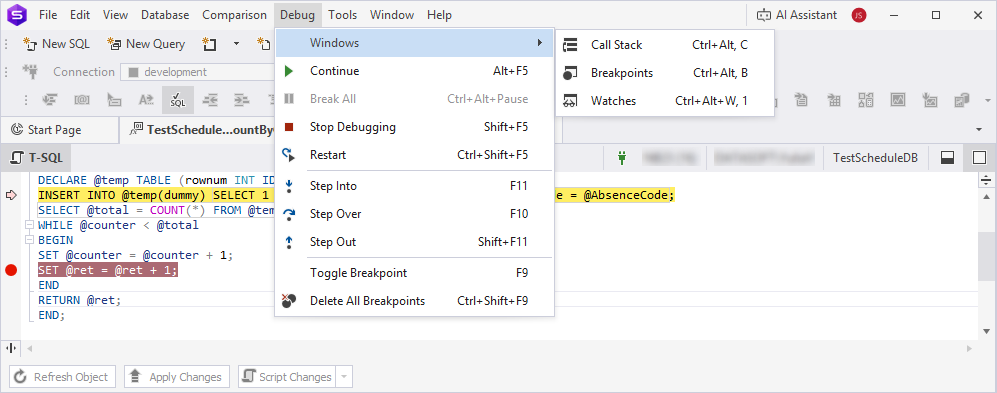
Debug menu
In the top menu, select Debug menu to access debugging commands.
Debug toolbar
When you start debugging, the Debug toolbar appears automatically, allowing you to manage the debugging process.

The table provides options from the Debug toolbar.
| Icon | Name | Description |
|---|---|---|
| Start | Starts the debugging process. | |
| Continue | Proceeds with the debugging process until it reaches the next breakpoint or the end of the debugging session. | |
| Execute Entire Script | Executes an entire script. | |
| Break All | Pauses the debugging process. | |
| Stop Debugging | Stops the debugging process. | |
| Restart | Restarts the debugging process. | |
| Step Into | Enters the function and pauses at the first executable line inside it. | |
| Step Over | Executes the entire function, then halts at the first line outside the function. The command can also be used to avoid stepping into functions. |
|
| Step Out | Runs the current function and stops the execution until the current function is returned or the breakpoint occurs. | |
| Call Stack | Opens the Call Stack pane. | |
| Breakpoints | Opens the Breakpoints pane. | |
| Watches | Opens the Watches pane. |
Note
It is recommended to debug Transact-SQL code on a test server, not a production one. Debugging sessions can be time-consuming, and any locks acquired during the session may be held for extended periods, potentially impacting performance or availability.
Access the Debugger
To access the Debugger, use the Debug menu or Debug toolbar. Debugger windows and dialogs display information about database objects and let you enter additional details.
To get Help for the dialog, press F1.
Debug menu
On the top menu, select Debug menu to access debugging commands.
Debug toolbar
When you start debugging, the Debug toolbar appears automatically, allowing you to manage the debugging process.
The table provides options from the Debug toolbar.
| Icon | Name | Description |
|---|---|---|
| Start | Starts the debugging process. | |
| Continue | Proceeds with the debugging process until it reaches the next breakpoint or the end of the debugging session. | |
| Execute Entire Script | Executes an entire script. | |
| Break All | Pauses the debugging process. | |
| Stop Debugging | Stops the debugging process. | |
| Restart | Restarts the debugging process. | |
| Step Into | Enters the function and pauses at the first executable line inside it. | |
| Step Over | Executes the entire function, then halts at the first line outside the function. The command can also be used to avoid stepping into functions. |
|
| Step Out | Runs the current function and stops the execution until the current function is returned or the breakpoint occurs. | |
| Call Stack | Opens the Call Stack pane. | |
| Breakpoints | Opens the Breakpoints pane. | |
| Watches | Opens the Watches pane. |
Note
It is recommended to debug Transact-SQL code on a test server, not a production one. Debugging sessions can be time-consuming, and any locks acquired during the session may be held for extended periods, potentially impacting performance or availability.
Debug layout
dbForge Studio supports two window layouts:
- Default layout, which is used during regular development tasks.
- Debug layout, which is automatically applied when you start a debugging session.
Each layout keeps its state when you start or stop debugging, or when you exit and restart the Studio.
Note
The Watches and Call Stack panes are available only in the Debug layout.
Watches
The Watches pane lets you monitor the current values of variables or expressions during the debugging session.
Note
The Debugger does not yet evaluate expressions that include variables and constants, such as
@a - @bor@a - 1, and treats them as literal text.
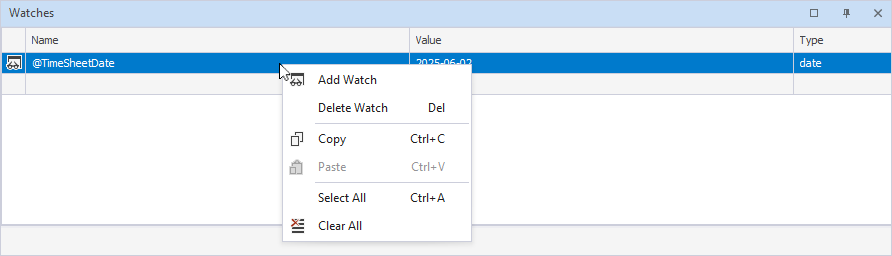
The grid displays the following:
- Name: Identifier or expression you are watching, for example, a variable.
- Value: Current value of the variable or expression at the breakpoint or during the current step in debugging.
- Type: Data type of the variable or expression being watched.
The grid can contain the following identifiers:
 – The watch was successfully added to the Watches pane.
 – The watch cannot be evaluated.
You can also right-click the grid and select the required option.
The table describes the shortcut menu options from the grid.
| Name | Description |
|---|---|
| Add Watch | Adds a watch. |
| Delete Watch | Deletes a watch. |
| Copy | Copies the watch to the clipboard. |
| Paste | Inserts the copied watch to the required place. |
| Select All | Selects all watches. |
| Clear All | Removes all watches. |
Call Stack
The Call Stack pane lists all active function or procedure calls. Each entry, or stack frame, shows the function name, its parameters, and local variables. The top frame indicates the function where execution is currently paused, and the bottom frame shows the initial entry point that began the call sequence.
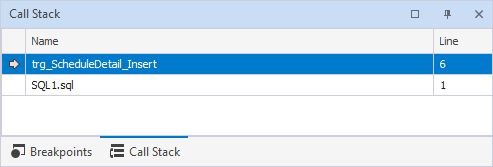
The grid displays the following:
- Name: Name of the function or method currently on that stack frame.
- Line: Line number in the source code where the Debugger is currently paused or where the function was called.
You can also right-click the grid and select the required option.
The table describes the shortcut menu options from the grid.
| Name | Description |
|---|---|
| Go To Source Code | Navigates you directly to the line of code in the source script where the selected stack frame is set. |
| Copy | Copies the stack frame to the clipboard. |