How to filter trace events
To filter trace events:
- On the Profile Server Events toolbar, click Stop Trace.
- Click the Filter glyph on a column header
- Select a filter from the list.
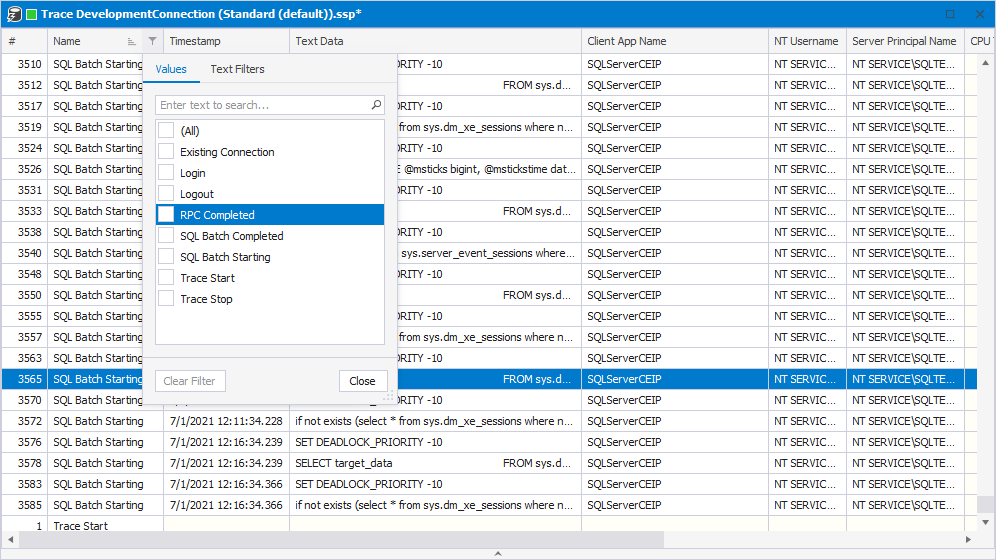
Each data column has different filter criteria:
- Numeric and datetime columns have =,<>,>=, and <= filters
- String columns have LIKE and NOT LIKE filters
- String columns can use % character as a wildcard
- Datetime filters must use format YYY/MM/DD hh:mm:ss
Note, that not all data columns can be filtered in Trace: data has to exist for the filter to be applied. Event Profiler displays only available filter criteria for data columns. Filters are applied at the trace level to all events in the trace. Not all events populate the same kind of data in the same columns. Many columns have overloaded values based on the event being collected.