How to profile server events
Permissions required to run Event Profiler
To run Event Profiler, users must be granted the following permissions:
- ALTER TRACE
- ALTER ANY EVENT SESSION
- CONNECT SQL
- VIEW SERVER STATE TO login_name
To grant the permissions:
- Open Security Manager, expand the Logins node, and then select a required user login in the tree.
- Switch to the Server Permissions tab of Logins Editor.
- Select the Granted check box next to the permissions.
For more information, refer to Manipulating User Logins.
Create a new trace
1. On the Start page, navigate to Administration, and then click Profile Server Events. The Profile Server Events wizard appears.
2. Specify the connection.
3. Optionally, select a profiling template, modify the trace file settings and the data storage settings. Click Next.
Note
If no template is selected, the Standard template will be used by default.
4. On the Events to Capture page, select the events you want to capture. Click Next.
Note
By default, the wizard shows the events, that are included into the selected template. To add additional events, select the Show all check-mark.
5. Optionally, on the Actions page, select the actions you want to capture in the current events session. Click Next.
6. Optionally, on the Event Filters page, specify filter options to limit the tracing data.
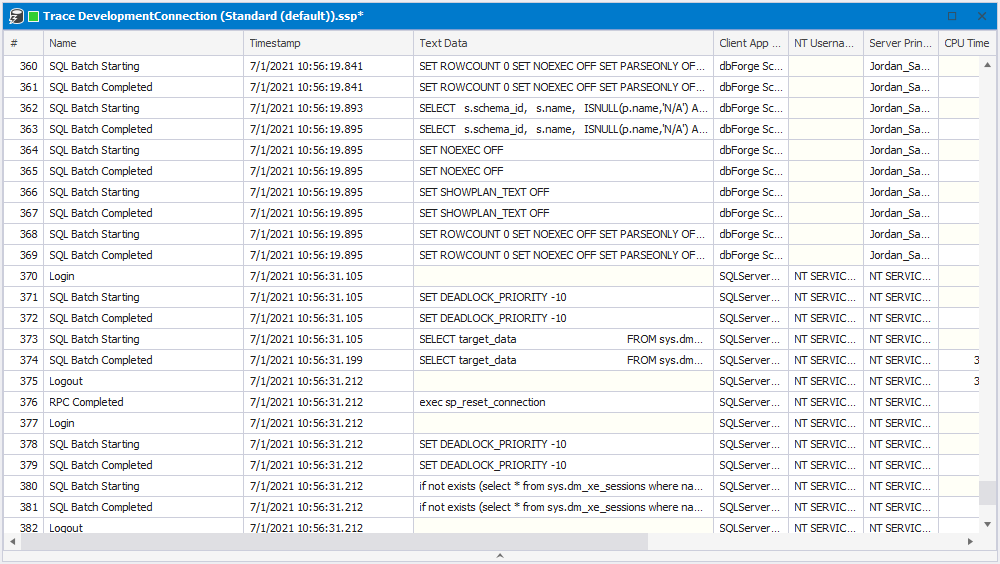
7. Click Execute. The Trace will start and the Server Event Profiler Document opens.
Download dbForge Studio for SQL Server and try it absolutely free for 30 days!