Work with query plan diagrams
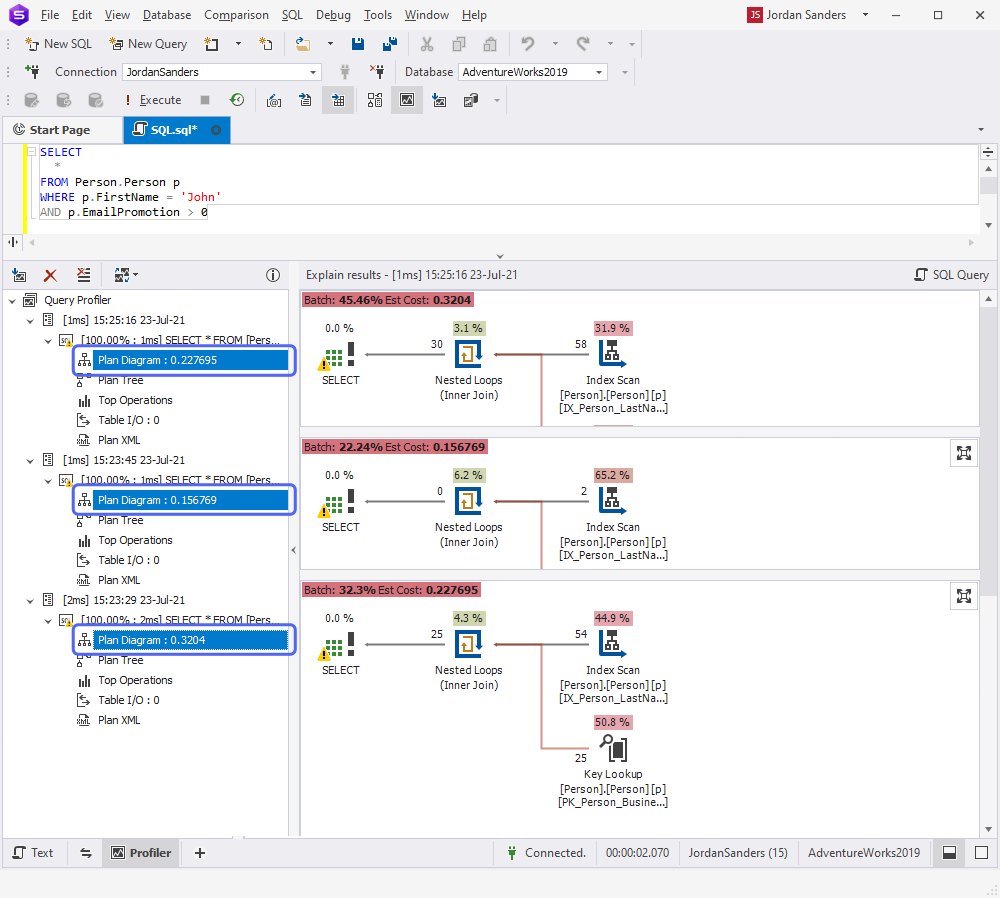
Query Profiler lets you view and analyze execution plans for multiple queries in a single document. The execution plan provides a visual representation of the query estimated performance and helps you optimize SQL queries.
To analyze multiple plans, hold down Ctrl and select several plan diagrams in the Query Profiler tree.
Compare multiple execution plans
You can compare several execution plans side by side to evaluate query performance before and after changes.
To compare multiple execution plans:
1. On the Query Profiler toolbar, click ![]() .
.
2. Choose the number of recent results to compare, such as Compare last two results.
3. Modify your query.
4. Click ![]() .
.
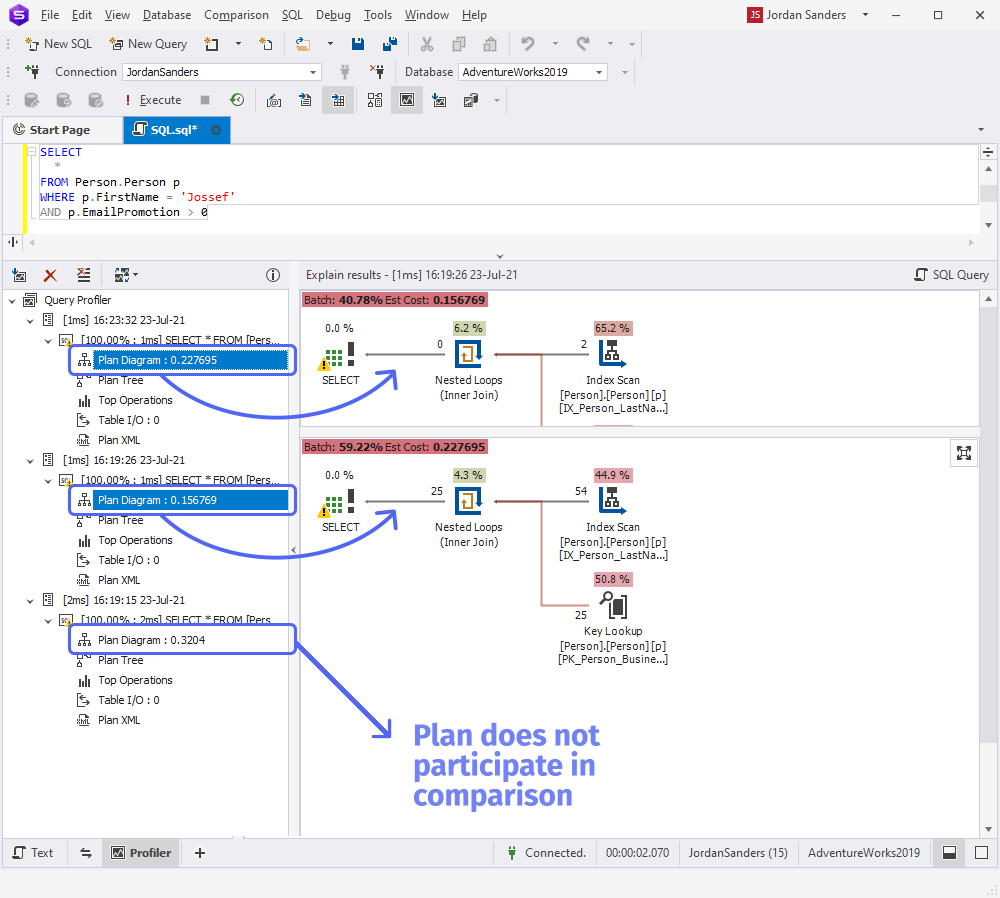
The most recent result is automatically compared with the previous plan (Plan #2).
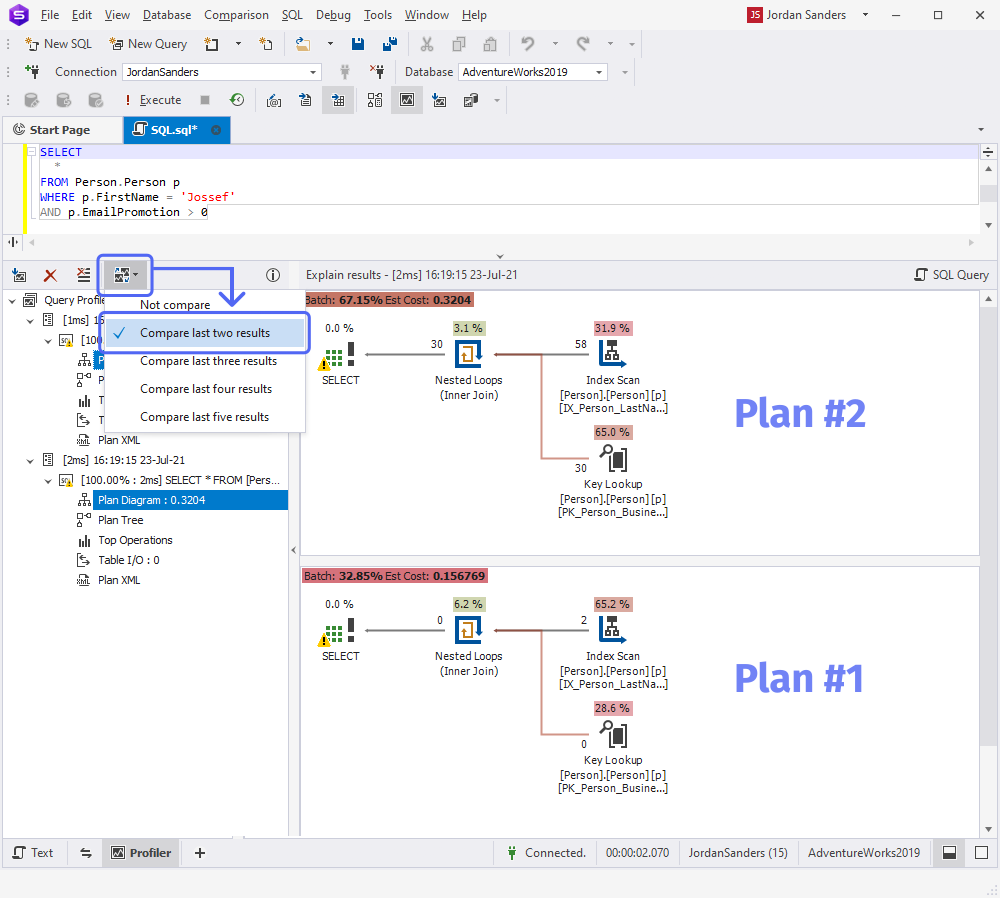
Older plans, such as Plan #1, are not included in the comparison.
Shortcut menu options
You can perform operations directly from the plan diagram using the shortcut menu.
The table describes the shortcut menu commands.
| Name | Description |
|---|---|
| Cost By: | Sets the metric to calculate and highlight cost percentages for each step in the plan. The available options are:
|
| Lines Width By: | Adjusts line width in the diagram to reflect the volume of data transferred between operations. The wider the line, the more rows (or bytes) are passed between those operators. The available options are Rows (default) and Data Size. |
| Zoom | Increases or decreases the plan diagram size. The available options are:
|
| Export to Image | Exports the plan diagram to the following file formats: .bmp, .jpg, .gif, .png, .tif, and .emf. |
| Opens the Print window to configure printing settings and print the plan diagram. | |
| Properties | Opens the Properties window for the selected operator. |
| Save Execution Plan As | Saves the execution plan in a .sqlplan file format. |
Export a plan diagram to an image
dbForge Studio supports plan diagram export to the following formats: .bmp, .jpg, .gif, .png, .tif, and .emf.
To export a diagram:
1. Right-click the plan diagram and select Export to Image.
2. In the Save As window, specify a folder to store the file and a file name, and choose an image format.
3. To save the changes, click Save.