Query profiling mode
You can use Query profiling mode to analyze and optimize SQL queries, reduce execution time, and improve overall database performance. When comparing multiple queries, Query Profiler collects and displays profiling data, using green indicators for efficient queries and red indicators for inefficient ones. Each time you run a query, Query Profiler saves the query plan, allowing you to compare performance before and after making optimizations.
The guide describes how to profile a SQL query and optimize SQL query performance using the Query Profiler tool.
Note
You can also use dbForge AI Assistant to explore the bottlenecks of your code and optimize performance.
Worked example: How to use Query Profiler to optimize query performance
The example demonstrates how to use Query Profiler to identify a performance issue and resolve it by adding a non-clustered index.
The query retrieves all records from the Person table where FirstName is Robin:
SELECT
*
FROM AdventureWorks2022.Person.Person
WHERE FirstName = 'Robin'
Initially, there is no index on the FirstName column, which may result in inefficient execution. Using Query Profiler, you can identify the performance bottleneck and resolve it by adding an index on that column.
Prerequisite
Before you start, turn off the paged mode to get the correct results.
To turn off the paged mode:
1. In the top menu, select Tools > Options.
2. Select Data Editor > General.
3. Clear Use paginal mode by default.
4. To apply the changes, click OK.
Step 1: Profile a SQL query
1. Run Query Profiler by doing one of the following:
-
On the Start Page, select Query Profiler.
-
In the top menu, select SQL > Query Profiling Mode.
-
On the SQL toolbar, click
 .
.
2. In a new SQL document, enter the query.
3. To execute the query, click Execute on the SQL toolbar or press F5.
The plan diagram opens with a warning icon (an exclamation mark) on the SELECT operator. When you hover over the icon, a tooltip appears showing the execution plan details and a warning that an index is missing.

Step 2: Optimize the query
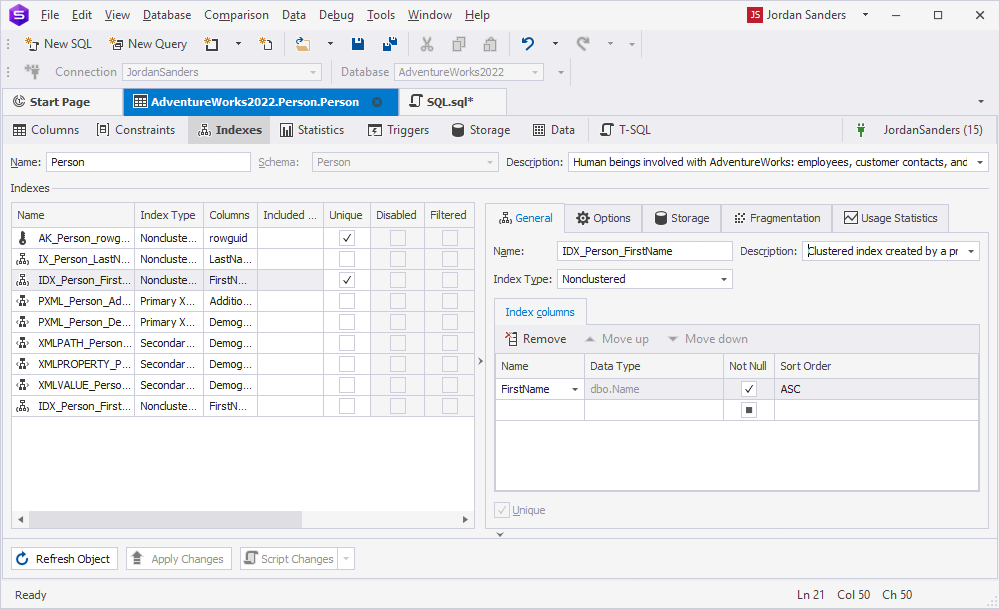
1. In Database Explorer, expand the Person table.
2. Right-click the Indexes folder and select New Index > Non-Clustered Index.
The Indexes tab of Table Editor opens.
3. In the Index Properties grid, navigate to General > Index columns.
4. In the Name column, select FirstName from the list.
5. To save and apply the changes, select Apply Changes.
6. Return to the Query Profiler document.
7. On the toolbar, click ![]() .
.
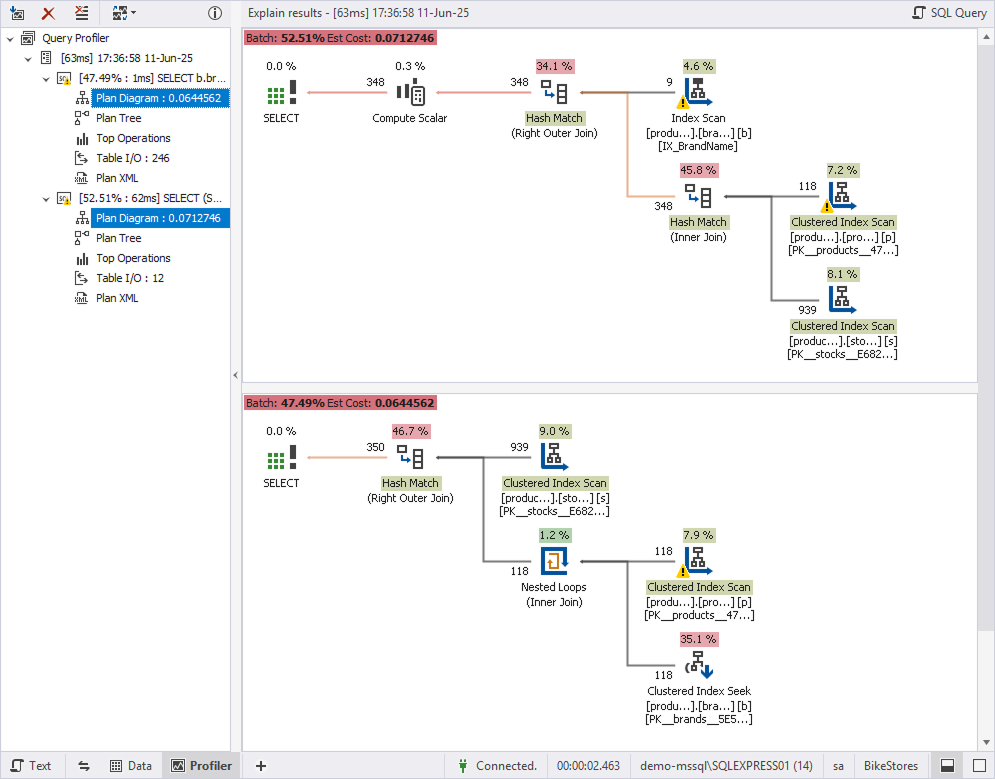
Each profiling session appears as a separate entry in the tree view, labeled with the execution time and date. This allows you to compare performance before and after editing a query.
Compare profiling results
To compare profiling results, hold down Ctrl and select the plan diagrams of the executed queries.
Note
When you save the query file, the profiling results are automatically stored in the .design file.