Set events to capture
After you set up general profiler options, you can select the events you want to capture on the Events To Capture page of the Profile Server Events wizard.
To create a profile session, use one of the following ways:
- In the upper-right corner of the start page, click New.
- On the toolbar, click Profile Server Events.
- On the File menu, click New > Profile Server Events.
To open the recently saved profile session, click the session to retrieve in the Recent Projects section of the Start Page.
The Events To Capture page of the Profile Server Events wizard opens with the default set of events grouped in the Execution and Session categories. You can view the detailed description of the selected event in the Description field.
We recommend referring to the official Microsoft documentation to view the full list of event categories and the corresponding event classes that can be captured using dbForge Event Profiler.
Note
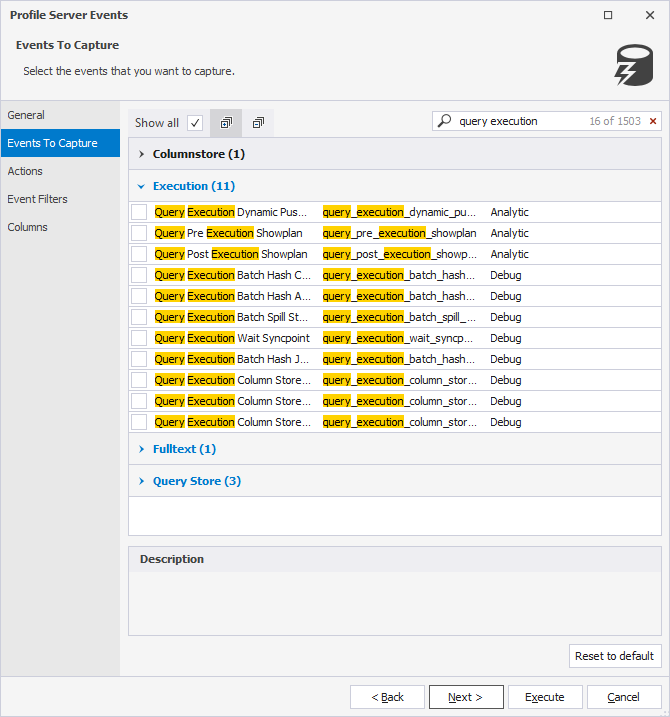
By default, the wizard shows the events that belong to the selected template. To display all events, select the Show all checkbox.
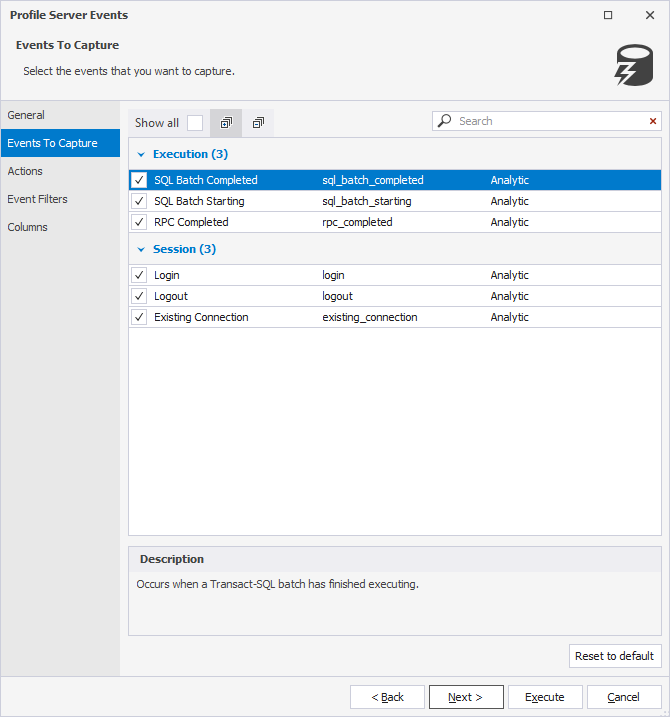
To include the events to be captured in the current session, select the checkboxes next to the corresponding events. To exclude the events from the session, clear the checkboxes next to the required events.
On the toolbar, you can perform the following actions:

- Select the Show all checkbox to display all the events to be captured in a session.
- Click Expand all to open all the events in addition to the selected ones.
- Click Collapse all to hide the events and display them grouped by specific categories, such as Alwayson, Backup Restore, Change Tracking, Data Masking, Errors, Execution, etc.
- Search for the event to be captured. In the search bar, type the text. All the matching events will be highlighted in the grid.
Note
For a proper work of the search functionality, the Show all checkbox must be selected.
To restore the options to the original settings, click Reset to default.
Clicking Execute will automatically run event tracing, and dbForge Event Profiler wiil begin to collect the data. For more information, see Capturing server events.