Capture server events
dbForge Event Profiler is a tool to collect and analyze information about events occurring on a server. It helps in monitoring the performance and analyzing resource utilization of the server, as well as in identifying and troubleshooting SQL Server issues that may arise during different events or operations.
You can analyze and trace data of the event session using the Profile Server Events wizard available in dbForge Event Profiler. To open the wizard, use one of the following ways:
- In the upper-right corner of the Start Page, click New to create a session.
- On the toolbar, click Profile Server Events.
- On the File menu, click New > Profile Server Events.
- In the Recent Projects section of the Start Page, click the project to open the recently saved profile session.
Permissions required to run dbForge Event Profiler
Before creating a trace, make sure that the user you are currently logged in has been granted the necessary permissions to run dbForge Event Profiler:
- ALTER TRACE
- ALTER ANY EVENT SESSION
- CONNECT SQL
- VIEW SERVER STATE TO login_name
To create a trace
1. On the Start Page, click New Events Profiler to open the Profile Server Events wizard.
2. On the General page, do the following:
- Specify the server connection.
- Specify a trace template on which the trace will be based.
- Modify the trace file and session data storage settings.
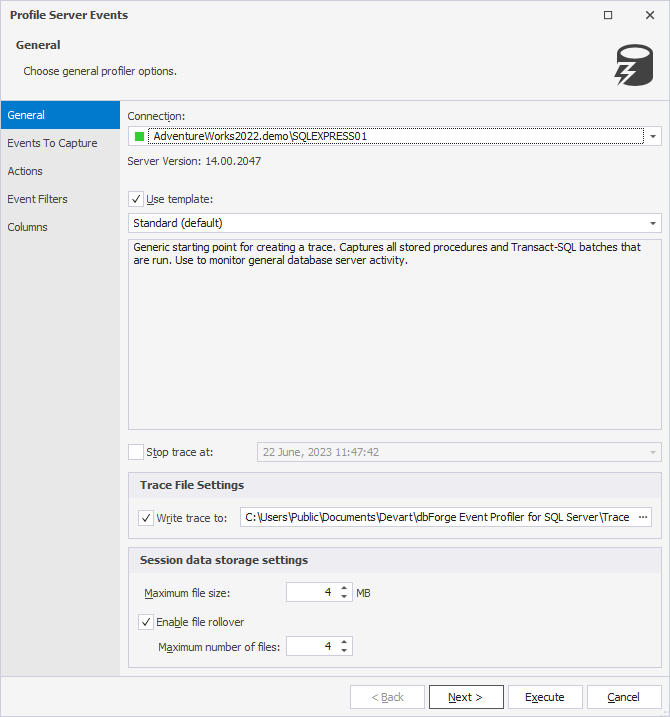
Note
If no template is selected, the Standard template will be used by default.
3. Click Execute to run the trace with the default settings. As soon as the Server Profile document opens, the trace starts and the tool begins to collect the data.
To customize the profiling trace, refer to the following topics:
View the Server Profile document
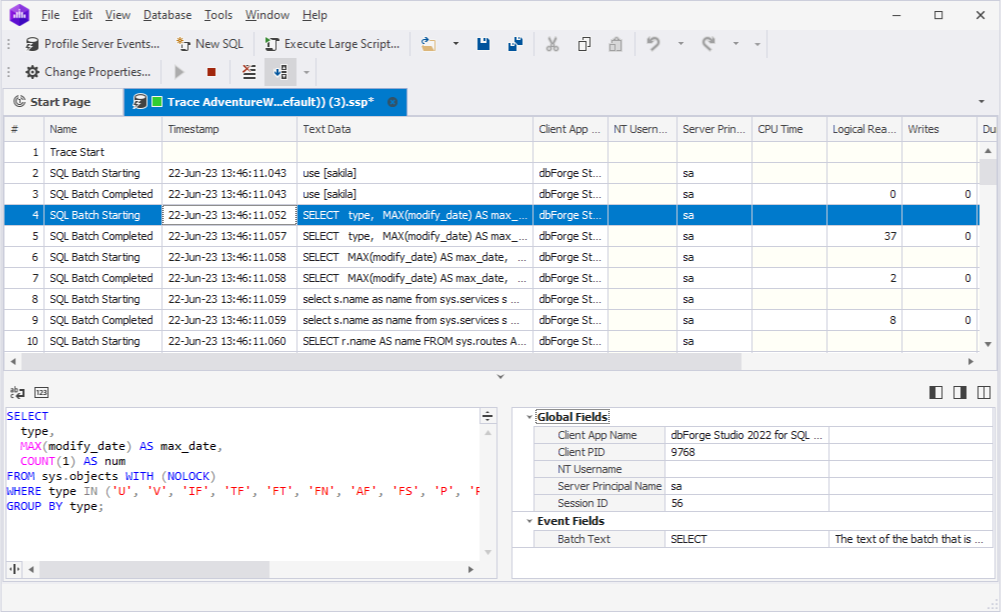
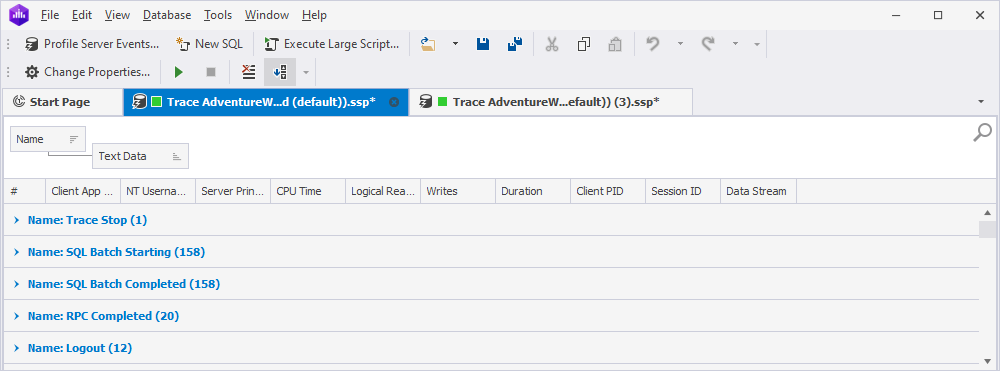
The Server profile document information about the events captured in a trace according to the defined trace settings. The grid displays the default columns that can be changed on the Columns page of the Profile Server Events wizard. For more information, see Session parameters to display.
The Name column refers to the events you want to capture. The Timestamp column displays the date and time when the event was captured. The Text Data column shows the SQL statement associated with the event. The other columns in the grid can be configured and customized on the Columns page of the Profile Server Events wizard.
The left pane shows the SQL statement of the event selected in the grid. The right pane is divided into two sections:
- Global Fields presents the actions performed on the specified column during the current event session.
- Event Fields provides detailed information about specific elements of the events helping in troubleshooting SQL Server issues. The elements include batch text, CPU time, duration, logical and physical reads, result, row count, and writes.
Use the Server Profile document toolbar
From the Event Profiler toolbar, you can perform the following operations:

- Edit the trace settings for the current event session by clicking Change Properties. This will open the Profile Server Events wizard where you can customize the settings.
- Stop a trace by clicking Stop Trace. This will stop data capture.
- Re-run the current trace by clicking Start Trace. This will continue capturing data.
- Remove the event details from the Server Profile document by clicking Clear Trace Window.
- Disable automatic scrolling for the trace by clicking Auto Scroll Window. By default, it is enabled.
Customize the appearance of the Server Profile document
You can adjust the appearance of the Server Profile document only after the trace is stopped.
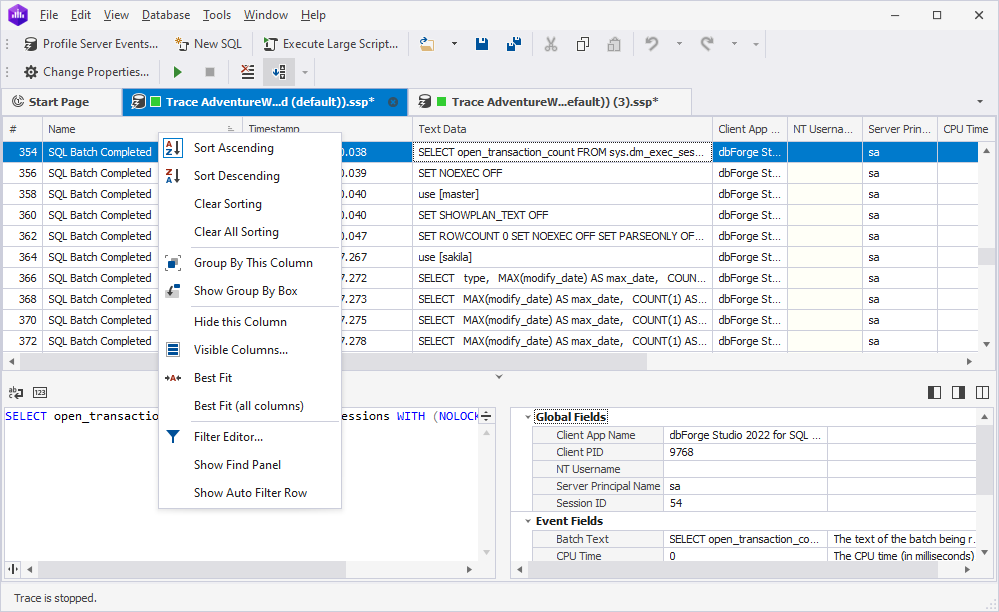
Group and sort data
Right-click the header of the column and select the required option:
- Sort Ascending or Sort Descending to sort the columns in an ascending or descending order, respectively.
- Clear Sorting to remove the sorting criteria applied to the current column.
- Clear All Sorting to remove all sorting criteria and restore the default order.
- Group By This Column to group data by the current column and automatically display it as collapsable groups.
- Hide Group By Box to ungroup the data by the current column.
- Hide this Column to hide the column from the Server Profile document.
- Visible Columns to hide or show column data in the Server Profile document.
- Best Fit to adjust the column width to the column content.
- Best Fit (all columns) to adjust widths of all columns simultaneously.
- Filter Editor to open the Filter Editor window to set filter criteria.
- Show Find Panel to open the search bar to search for the text within the Server Profile document.
- Show Auto Filter Row to open the automatic filtering row that allows filtering data while typing the text in that row. For more information, see Filter data with Auto Filter Row.
Sort trace events
To enable sorting options, stop tracing server events by clicking Stop Trace on the Profile Server Events toolbar.
To sort trace events in the document or to change the sort order, click a column header. Alternatively, right-click the column header and then select Sort Ascending or Sort Descending.
To assign a secondary sorting, click another column header while holding the SHIFT key. You can set as many sorting columns as you need. To stop sorting on a specific column, click it while holding the CTRL key. The sort glyph indicates the current sort order of a column. You can see both the descending and ascending glyphs in the screenshot below. If the column is not sorted, the sort glyph is hidden.
To clear column sorting, right-click the column header and select Clear Sorting.
![]()
Group data by the current column
1. Right-click the column header by which you want to group the events and select Group By This Column.
The events are now displayed in collapsable groups, and the column header is moved to the Group By Box panel on top of the Server Profile document grid, where you can see the grouping order and perform further operations related to the group. Drag a column header to the Group By Box panel to group the data by that column. You can group the data by multiple columns. In this case, the panel will display a tree of nested groups.
To expand or collapse all groups simultaneously, right-click the Group By Box panel and then select Full Expand or Full Collapse.
To cancel grouping by a column, drag the column header to the grid. Alternatively, right-click the column header and select Ungroup. To remove all groupings, right-click the Group By Box panel and select Clear Grouping.
Hide or show column data
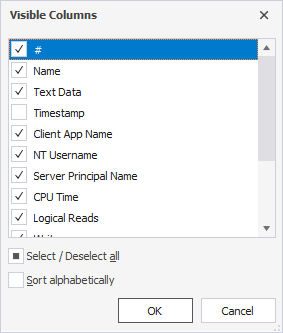
1. Right-click the column header and select Visible Columns.
2. In the Visible Columns window that opens, you can do the following:
- Select the checkboxes next to the columns you want to display in the Server Profile document.
- Clear the checkboxes for the columns you want to hide in the Server Profile document.
- Select the Select/Deselect all checkbox to display/hide all columns.
- Select the Sort alphabetically checkbox to arrange the columns in alphabetical order.
3. To save the changes, click OK. To discard the changes, click Cancel.
Set filter criteria
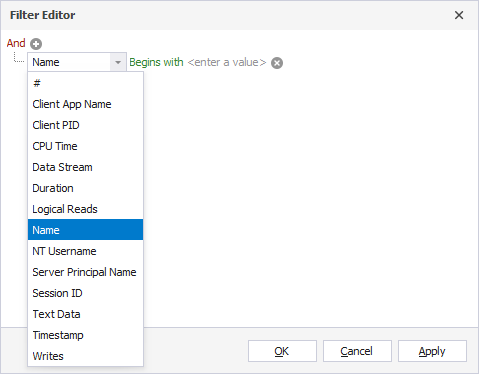
1. Right-click the column header and select Filter Editor to set the filter criteria.
2. In the Filter Editor dialog that opens, click the upper-level operator to select the operator and set the filter criteria:
- And (default option) displays the records when both conditions are TRUE.
- Or displays the records when at least one of the conditions is TRUE.
- Not (And/Or) meets the opposite condition set in the WHERE clause.
3. In the Name field, select the column name from the dropdown list.
4. In the Begins with field, select the comparison or logical operator for the condition from the dropdown list.
5. In the enter a value field, set the condition.
6. To save the changes, click OK. To apply the changes, click Apply.
Filter data with Auto Filter Row
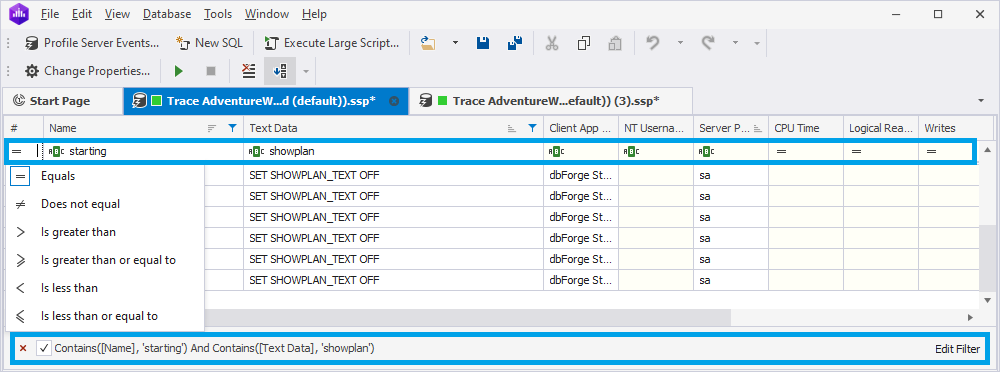
1. Right-click the column header and select Show Auto Filter Row to display the row that allows you to filter the data on the fly by typing the text in that row. The data will be automatically filtered based on the text specified in that row.
2. The automatic filtering row will be displayed on top of the columns in the grid.
3. On the left, select the comparison operator.
4. In the column you want to set the filter, enter the value by which the data will be filtered.
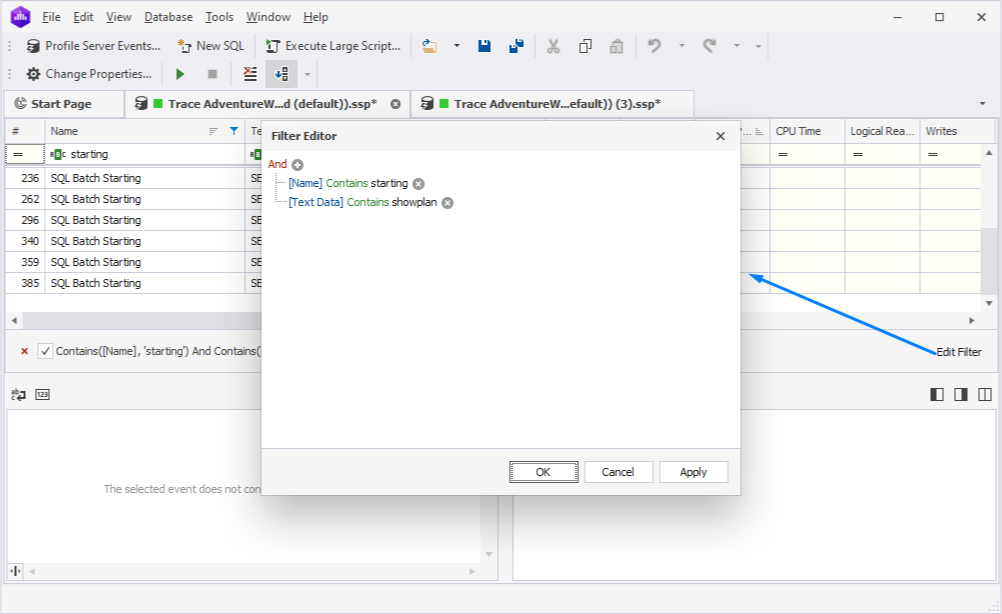
The filtering condition will be automatically displayed at the bottom of the Server Profile document. To remove the condition, click the cross icon or clear the checkbox at the bottom of the document. To edit the condition, click Edit Filter in the bottom right corner of the document.
The Filter Editor dialog opens where you can modify the conditions. To save the changes, click OK. To apply the conditions immediately, click Apply.
To discard the changes, click Cancel.
To hide the auto filter row, right-click the column header and select Hide Auto Row Filter.
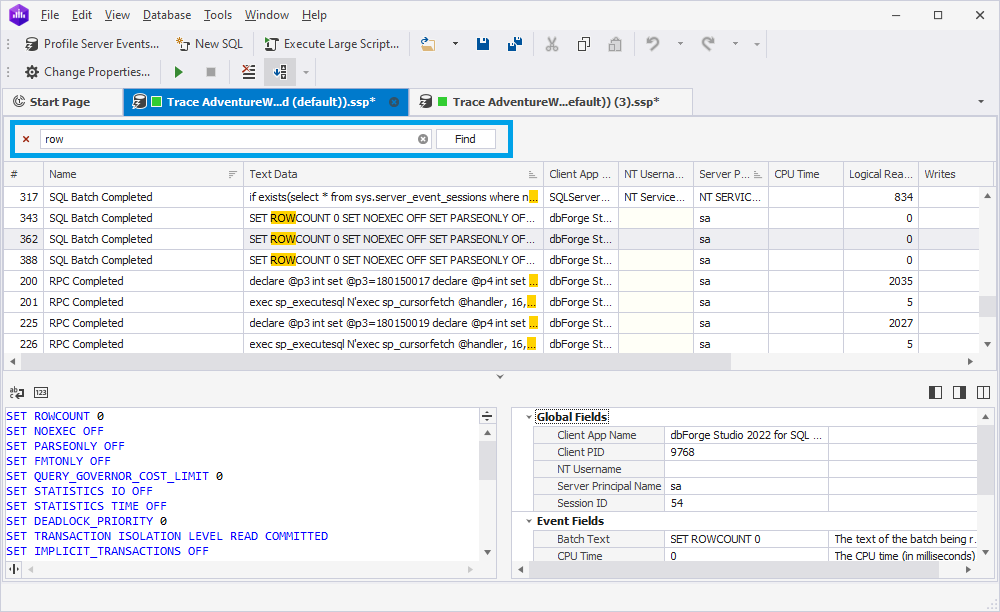
Search for the text
1. Right-click the column header and select Show Find Panel to open the search panel.
2. In the search panel, enter the text you want to find. The matching text will be highlighted with the yellow color.
3. To remove the search panel, click the cross icon on the left to the search bar.