Filter events to capture
When you create a trace, you can define criteria based on which data collected by the event will be filtered. This can be configured on the Event Filters page of the Profile Server Events wizard. Filters can help you reduce the output of the tracing data for the required event.
To create a profile session, use one of the following ways:
- In the upper-right corner of the start page, click New.
- On the toolbar, click Profile Server Events.
- On the File menu, click New > Profile Server Events.
To open the recently saved profile session, click the session to retrieve in the Recent Projects section of the Start page.
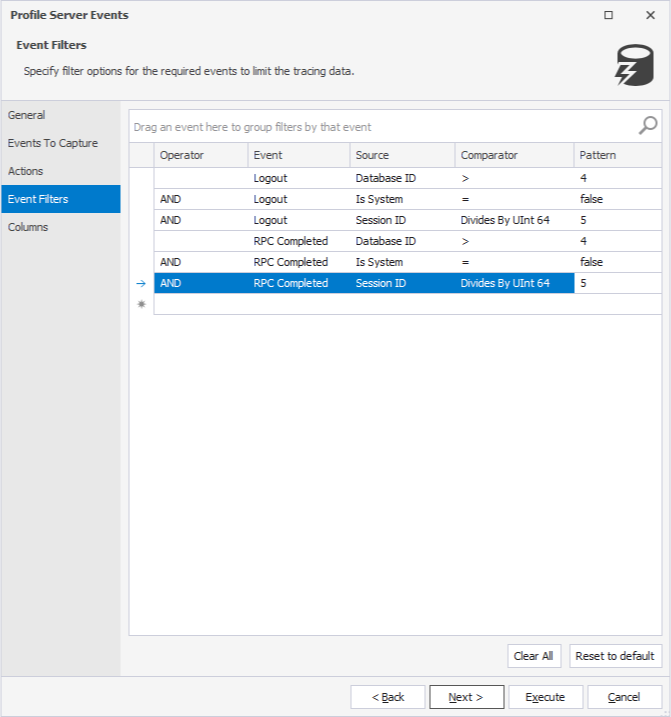
On the Event Filters page of the Profile Server Events wizard, you can specify the events to be included or excluded in/from the event session based on the following parameters:
- Operator that includes NOT, AND, OR, AND NOT, and OR NOT
- Event that includes All, Login, Logout, Existing Connection, SQL Batch Completed, SQL Batch Starting, and RPC Completed
- Source that includes the global fields based on the event you selected
- Comparator that provides comparison operators based on the event and source you selected
- Pattern that allows you to specify the filtering condition
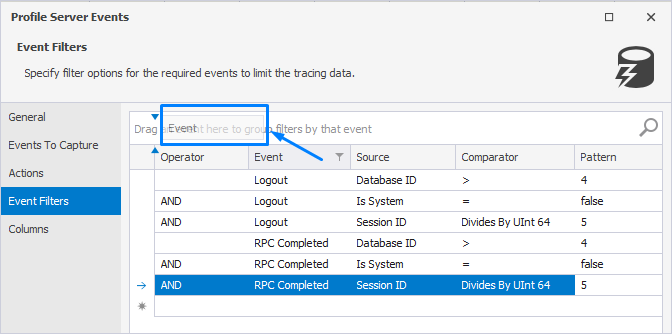
Group filters by event
You can group filters by the specific event. To do this, drag the Event column to the event field.
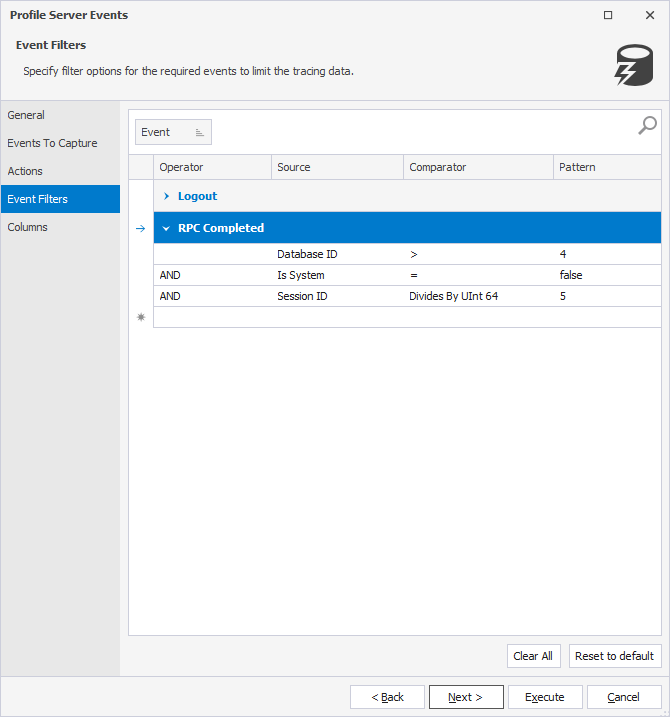
As you can see, the filters are now displayed as groups.
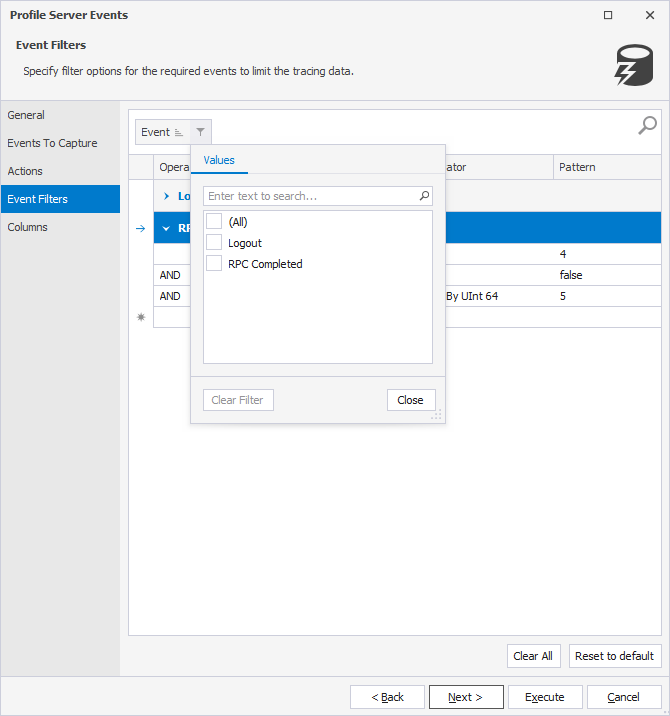
Manage filters
You can sort the filters of the group in a descending or ascending order. If you have multiple filters assigned, you can choose which filters to apply. To do this, click the filter icon on the Event column and select the corresponding checkboxes.
You can also right-click the group on the Group panel and select the required option on the shortcut menu as described in the Sort and group section of the Capture server events topic.
To remove the filters, click Clear All. To restore the filter options to the original settings, click Reset to default.
In addition, you can search for the text in the grid. To do this, in the search bar, type the text. Everything in the grid that matches the specified text will be highlighted.
Clicking Execute will automatically run event tracing, and dbForge Event Profiler begins to collect the data.. For more information, see Capturing server events.