Filter trace events
In the Server Profile document, events can be filtered only after the trace has been stopped. To stop the trace, on the Profile Server Events toolbar, click Stop Trace.
Each data column has different filter criteria:
- Numeric and datetime columns have =,<>,>=, and <= filters
- String columns have LIKE and NOT LIKE filters
- String columns can use the % character as a wildcard
- Datetime filters must use YYY/MM/DD hh:mm:ss format
Note that it is not possible to filter all columns of data in Trace. Filters can only be applied to the columns that contain data. Event Profiler will only display the filter criteria that are available for the data columns. Filters are applied at the trace level and affect all events within the trace. However, keep in mind that not all events populate the same type of data in the same columns. Many columns have overloaded values that depend on the specific event being collected.
Filter events by TextData
You can filter events by TextData in the following ways:
Filter the already traced events
1. On the Profile Server Events toolbar, click Stop Trace.
2. In the TextData column, click Filter.
3. On the Values tab, select the options by which you want the text data to be filtered.
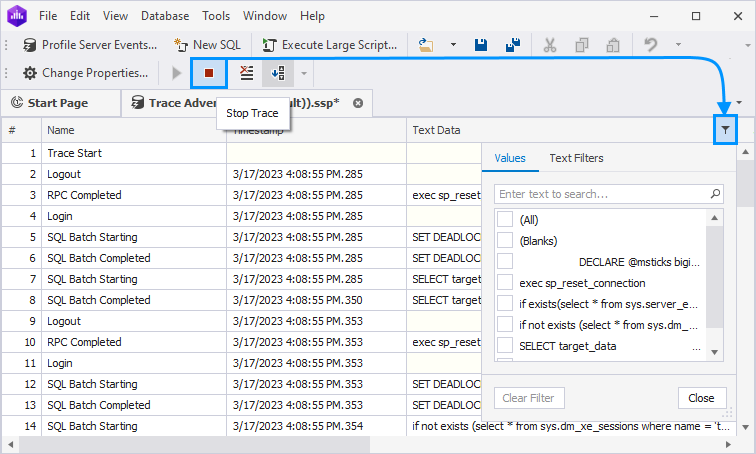
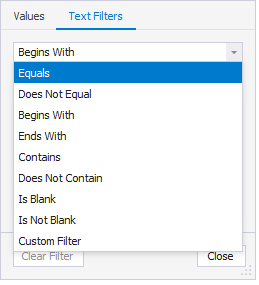
4. On the Text Filters tab, select the condition and enter the value.
5. The filter is applied on the fly. Click Close to close the window. Click Clear Filter to discard the changes.
Use the Statement property
1. On the toolbar, click Profile Server Events to open the wizard.
2. On the General page of the Profile Server Events wizard, select the connection and set up general profiler options.
3. Navigate to the Events to Capture page and select the events to be captured.
4. On the Actions page, select the actions you want to capture.
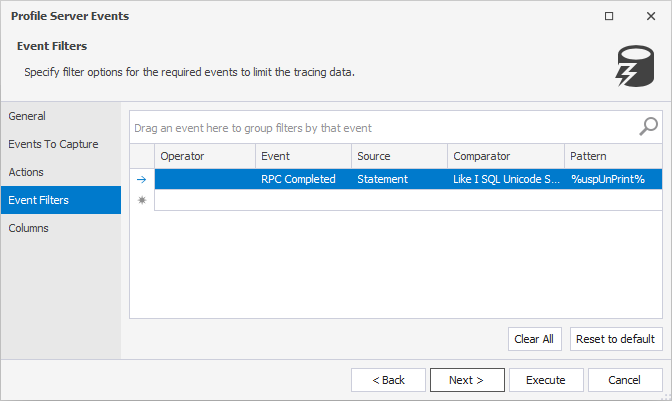
5. On the Event Filters page, specify the Statement property as the filter option to limit the tracing data.
6. On the Columns page, select the Statement column you want to capture in the current event session.
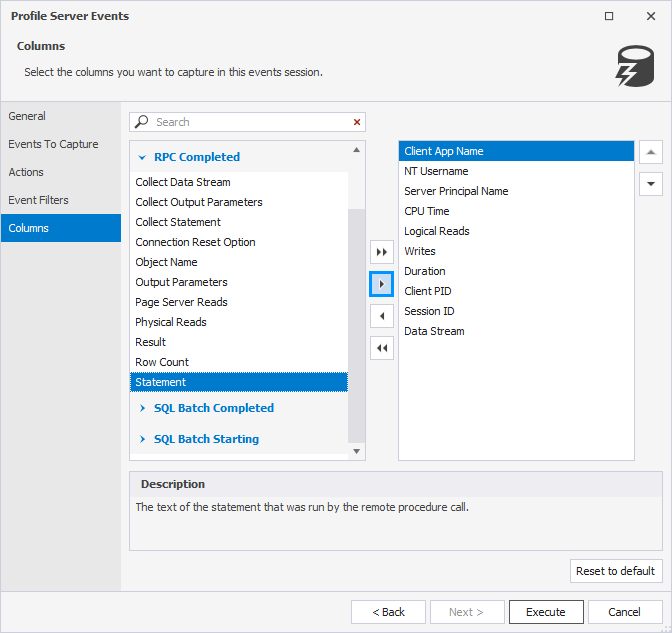
7. Click Execute to run event tracing. For more information, see Capturing server events.