Set actions to capture
After you set up general profiler options and selected the events to capture, you can select the actions to capture in the current event session on the Actions page of the Profile Server Events wizard.
To create a profile session, use one of the following ways:
- In the upper-right corner of the Start Page, click New.
- On the toolbar, click Profile Server Events.
- On the File menu, click New > Profile Server Events.
To open the recently saved profile session, click the session to retrieve in the Recent Projects section of the Start Page.
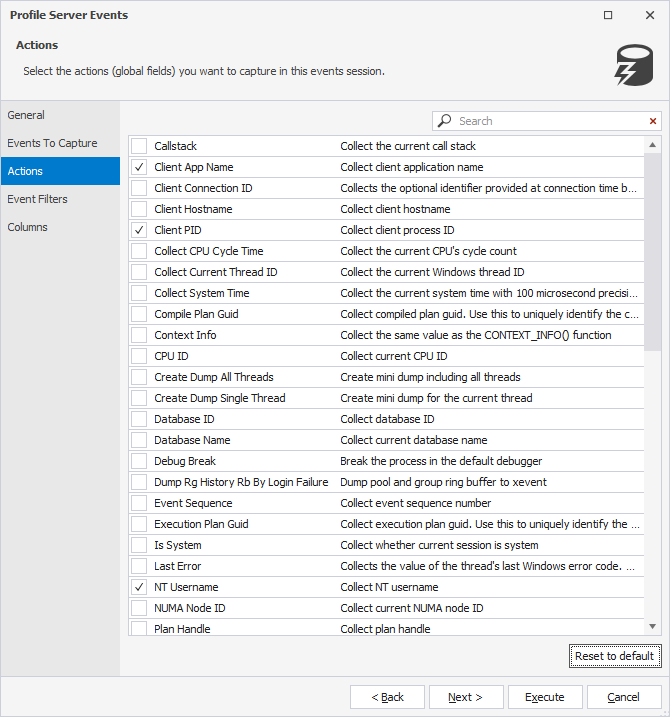
The Actions page of the Profile Server Events wizard displays the actions (global fields) you can capture in the current session. To include the actions to be captured in the events session, select the checkboxes next to the corresponding actions. To exclude the actions from the session, clear the checkboxes next to the required actions.
You can also search for the specific action. To do this, in the search bar, type the action name. The matching text will be highlighted in the grid.
To restore the options to the original settings, click Reset to default.
The table displays the actions that can be captured by dbForge Event Profiler.
| Name | Description | Default Action |
|---|---|---|
| Callstack | Collects the current call stack | No |
| Client App Name | Collects the client application name | Yes |
| Client Connection ID | Collects the optional identifier provided at connection time by a client | No |
| Client Hostname | Collects the client hostname | No |
| Client PID | Collect the client process ID | Yes |
| Collect CPU Cycle Time | Collects the current CPU’s cycle count | No |
| Collect Current Thread ID | Collects the current Windows thread ID | No |
| Collect System Time | Collects the current system time with 100 microsecond precision and interrupt tick resolution | No |
| Compile Plan Guid | Collects the compiled plan guid. Use this action to uniquely identify the compiled plan | No |
| Context Info | Collects the same value as the CONTEXT_INFO() function | No |
| CPU ID | Collects the current CPU ID | No |
| Create Dump All Threads | Creates mini dump including all threads | No |
| Create Dump Single Thread | Creates mini dump for the current thread | No |
| Database ID | Collects the database ID | No |
| Database Name | Collects the current database name | No |
| Debug Break | Breaks the process in the default debugger | No |
| Dump Rg History Rb By Login Failure | Dumps the pool and group ring buffer to xevent | No |
| Event Sequence | Collects the event sequence number | No |
| Execution Plan Guid | Collects the execution plan guid. Use this action to uniquely identify the execution plan | No |
| Is System | Collects whether the current session is system | No |
| Last Error | Collects the value of the thread’s last Windows error code. This is equivalent to the GetLastError API. | No |
| NT Username | Collects the NT username | Yes |
| NUMA Node ID | Collects the current NUMA node ID | No |
| Plan Handle | Collects the plan handle | No |
| Process ID | Collects the Windows process ID | No |
| Query Hash | Collects the query hash. Use this action to identify queries with similar logic or to determine the aggregate resource usage for queries that differ only by literal values | No |
| Query Hash Signed | Collects the query hash. Use this action to identify queries with similar logic or to determine the aggregate resource usage for queries that differ only by literal values | No |
| Query Plan Hash | Collects the query plan hash. Use this action to identify similar query execution plans or to find the cumulative cost of queries with similar execution plans | No |
| Query Plan Hash Signed | Collects the query plan hash. Use this action to identify similar query execution plans or to find the cumulative cost of queries with similar execution plans | No |
| Request ID | Collects the current request ID | No |
| Scheduler Address | Collects the current scheduler address | No |
| Scheduler ID | Collects the current scheduler ID | No |
| Server Instance Name | Collects the name of the Server instance | No |
| Principal Name | Collects the name of the Server Principal in which context the event is being fired | Yes |
| Server Principal SID | Collects the SID of the Server Prinicipal in which context the event is being fired | No |
| Session ID | Collects the session ID | Yes |
| Session NT Username | Collects the session’s NT username | No |
| Session Resource Group ID | Collects the current session resource group ID | No |
| Session Resource Pool ID | Collects the current session resource pool ID | No |
| Session Server Principal Name | Collects the name of the Server Principal that originated the session in which the event is being fired | No |
| SQL Text | Collects the SQL text | No |
| System Thread ID | Collects the current system thread ID | No |
| Task Address | Collects the current task address | No |
| Task Elapsed Quantum | Collects the current task quantum time | No |
| Task Resource Group ID | Collects the current task resource group ID | No |
| Task Resource Pool ID | Collects the current task resource pool ID | No |
| Task Time | Collects the current task execution time | No |
| Transaction ID | Collects the transaction ID | No |
| Transaction Sequence | Collects the current transaction sequence number | No |
| TSQL Frame | Collects the sql_handle for the current batch with line number, statement offsets and nesting level | No |
| TSQL Stack | Collects the Transact-SQL stack | No |
| Username | Collects the username | No |
| Worker Address | Collects the current worker address | No |
Clicking Execute will automatically run event tracing, and dbForge Event Profiler will begin to collect the data. For more information, see Capturing server events.