Set event sources
You can create a profile session by using one of the following ways:
- In the upper-right corner of the start page, click New.
- On the toolbar, click Profile Server Events.
- On the File menu, click New > Profile Server Events.
In addition, you can open the recently saved profile session. To do this, click the required session in the Recent Projects section of the Start Page.
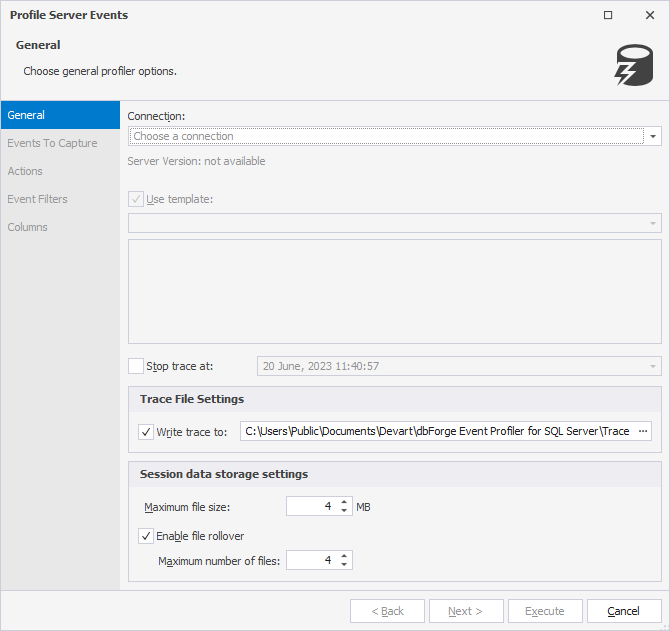
The General page of the Profile Server Events wizard opens where you can do the following:
- Connect to a server
- Use trace templates
- Manage trace file settings
- Configure session data storage settings
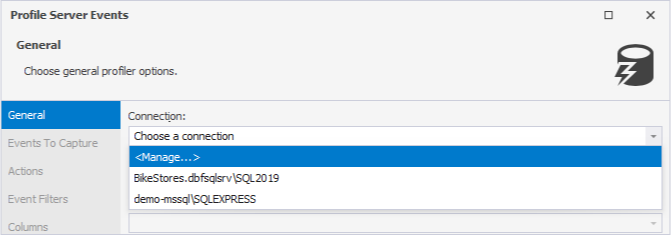
Connect to a server
From the Connection dropdown list, choose the previously established server connection to run a trace or click Manage to manage server connections.
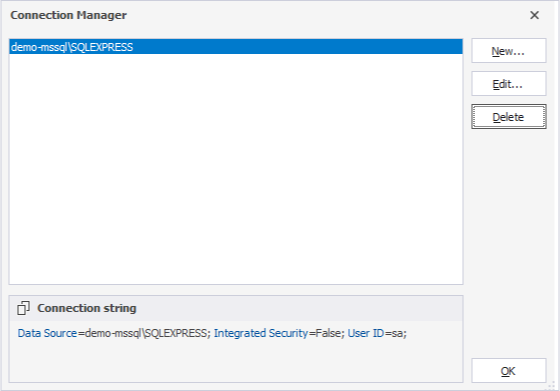
The Connection Manager opens that allows you to:
- Create a new connection or edit the existing one by clicking New and Edit respectively. This will open the Database Connection Properties dialog where you can configure server connection settings.
- Delete the server connection by clicking Delete.
Use trace templates
After the connection has been selected, the Use template checkbox becomes available so you can choose a template from the dropdown list.
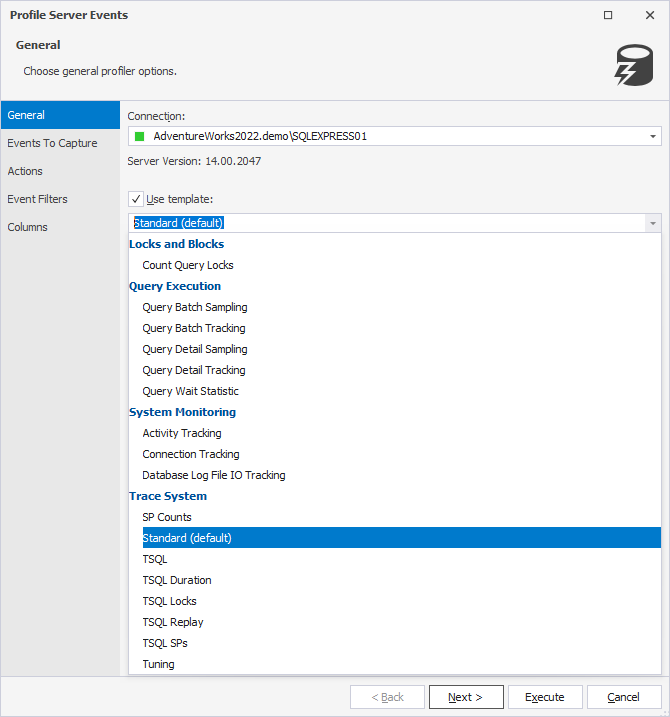
The template defines which types of events should be monitored and included in the trace. dbForge Event Profiler provides a set of predefined templates grouped by specific categories.
| Category | Template | Description |
|---|---|---|
| Locks and Blocks | Count Query Locks | Counts the number of locks acquired by each query based on the query_hash value. The template can also be used to identify the most lock intensive queries for investigation and tuning. |
| Query Execution | Query Batch Sampling | Collects batch and RPC level statements along with error information. The template can also be used to understand the query execution flow and tracking errors back to the specific queries that caused them. It should be noted that events are only collected from 20% of the active sessions on the server at any given time. The sampling rate can be adjusted by modifying the filter for the event session. |
| Query Execution | Query Batch Tracking | Collects batch and RPC level statements along with error information. The template can also be used to understand the flow of queries being executed on your system and track errors back to the queries that caused them. All batch events are collected in this session which may result in a large collection size. To reduce the collection size, consider using the Query Batch Sampling template, which already includes a filter. |
| Query Execution | Query Detail Sampling | Collects detailed statement and error information, as well as the query hash and query plan hash for every statement it tracks. The template can also be used to track each statement executed on your system as a result of query batches or stored procedures. It also facilitates tracking errors back to the specific statement that caused them. Events are only collected from 20% of the active sessions on the server at any given time. The sampling rate can be adjusted by modifying the filter for the event session. |
| Query Execution | Query Detail Tracking | Collects detailed statement and error information, as well as the query hash and query plan hash for every statement it tracks. The template can also be used to track each statement executed on your system as a result of query batches or stored procedures. It also facilitates tracking errors back to the specific statement that caused them. All statement events are collected in this session which may result in a large collection size. To reduce the collection size consider using the Query Detail Sampling template, which already includes a filter. |
| Query Execution | Query Wait Statistic | Tracks internal and external wait statistics for individual query statements, batches and RPCs. The template also collects the query hash and query plan hash for every statement it tracks. Events are only collected from 20% of the active sessions on the server at any given time. The sampling rate can be adjusted by modifying the filter for the event session. |
| System Monitoring | Activity Tracking | Tracks general activity on your system. The template does not include security audit events. If you want to audit your system, use the SQL Server Audit feature. |
| System Monitoring | Connection Tracking | Tracks connection activity for a server. Normal connection activity is tracked using the login and logout events, and issues are recorded using the connectivity_ring_buffer_recorded event. |
| System Monitoring | Database Log File IO Tracking | Monitors the IO for database log files on a server by tracking asynchronous IO, database log flushes, file writes, spinlock backoffs of type LOGFLUSHQ and waits of type WRITELOG. The template also collects data in two ways: raw data is collected to a ring buffer and spinlock backoff information is aggregated based on the input buffer (sql_text). The session is filtered for a single log file per database. If you have multiple log files you can modify the filter for the file_write_completed and file_written events to include more than just file_id = 2. |
| Trace System | SP Counts | Captures stored procedure execution behavior over time. |
| Trace System | Standard (default) | Generic starting point for creating a trace. The template captures all stored procedures and Transact-SQL batches being run. It can also be used to monitor general database server activity. |
| Trace System | TSQL | Captures all Transact-SQL statements submitted to SQL Server by clients and the time issued. The template can also be used to debug client applications. |
| Trace System | TSQL Duration | Captures all Transact-SQL statements submitted to SQL Server by clients and their execution time (in milliseconds). The template can also be used to identify slow queries. |
| Trace System | TSQL Locks | Captures all of the Transact-SQL statements submitted to SQL Server by clients along with exceptional lock events. The template can also be used to troubleshoot deadlocks, lock time-out, and lock escalation events. |
| Trace System | TSQL Replay | Captures detailed information about Transact-SQL statements that is required if the trace should be replayed. The template can also be used to perform iterative tuning, such as benchmark testing. |
| Trace System | TSQL SPs | Captures detailed information about all stored procedures being executed. The template can also be used to analyze the component steps of stored procedures. Add the sql_statement_recompile event if you suspect that procedures are being recompiled. |
| Trace System | Tuning | Captures information about stored procedures and Transact-SQL batch execution. |
Manage trace file settings
You can stop a trace at a specific timeframe. To do this, select the Stop trace at checkbox and specify the date and time. The default value is set to the date and time at which the trace has been stopped.
Stopping a trace suspends the data capture process. After a trace has been stopped, it is impossible to restart it without losing the previously captured data unless that data has been saved to a trace file. dbForge Event Profiler can automatically save the collected data to the profiler data file stored in the default directory - C:\Users\Public\Documents\Devart\dbForge Event Profiler for SQL Server\TraceTemplates.
To change the file that stores trace data, perform the following steps:
1. Click ![]() More options for the Write trace to checkbox selected by default.
More options for the Write trace to checkbox selected by default.
2. In the Save As dialog that opens, specify a path and filename, and then click Save.
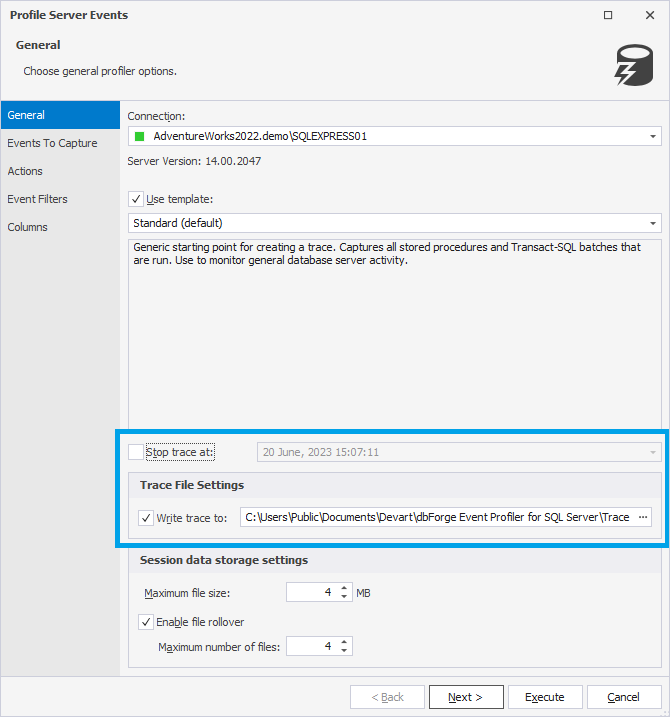
Configure session data storage settings
In the Session data storage settings section, you can set up the following options:
- Maximum file size: Specify the maximum file size for a trace file. The default value is 4 Mb. When the file size reaches the maximum limit, trace events will no longer be recorded in this file.
- Enable file rollover: Create a new file with trace data after the maximum file size is reached. When the option is turned off, the trace will be stopped after the file size limit is reached.
- Maximum number of files: Define the maximum number of files that can be stored within the current session. When the number of files exceeds the limit, the trace events will no longer be recorded. The default value is 4.
Clicking Execute will automatically run event tracing, and dbForge Event Profiler will begin to collect the data. For more information, see Capturing server events.