Query History
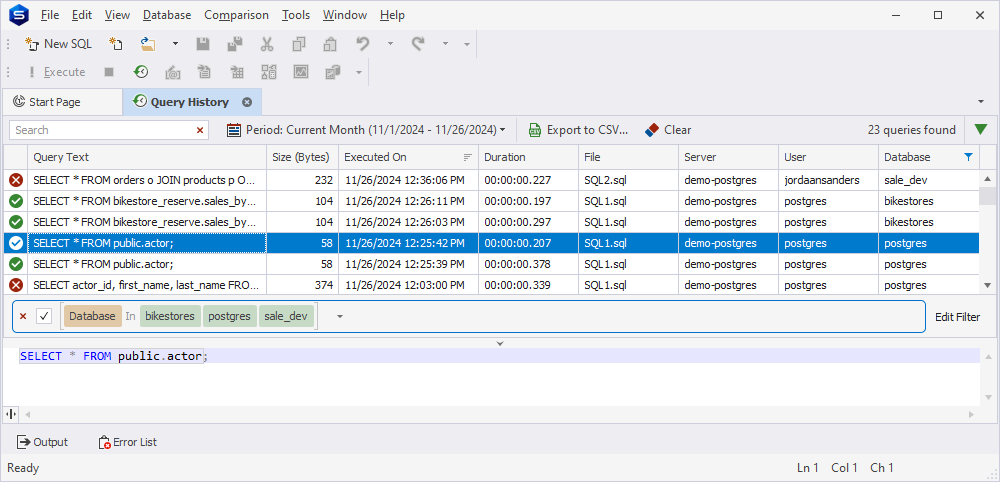
The Query History document is designed to keep track of all the queries that have been executed within the SQL Document. The feature enables users to view and manage query history, edit and execute queries, apply filters, perform searches, and export data for backup or sharing.
Open the Query History document
The Query History document can be opened using one of the following ways:
-
On the SQL toolbar, select
 Show Query History.
Note
If the SQL toolbar is turned off, you can turn it on by navigating to the View menu and selecting Toolbars > SQL.
- On the ribbon, select View > Other Windows > Show Query History.
- Press Ctrl+Alt+H.
Hovering over the row in the Query Text column will display the text of the executed query.
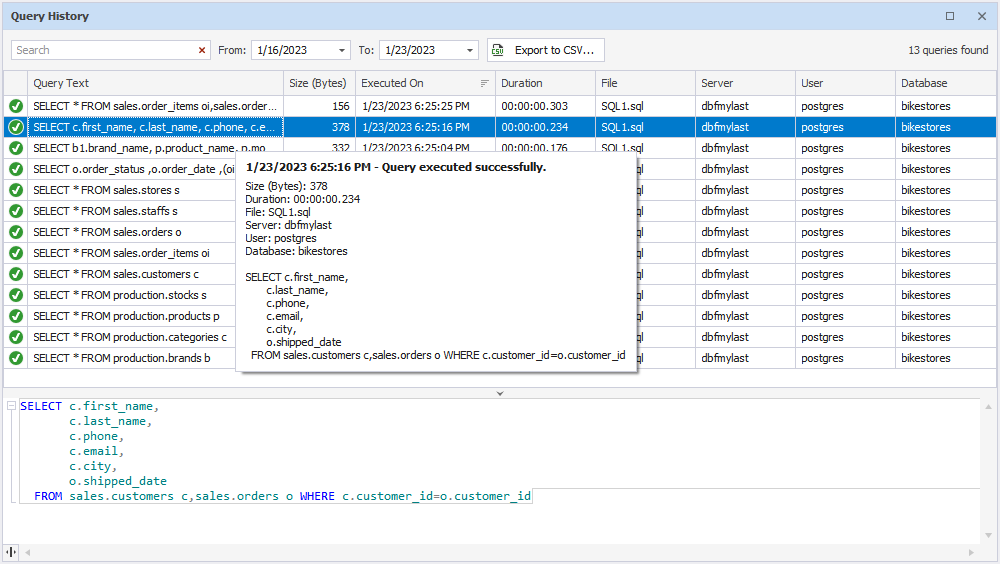
The Query History document is organized into two main sections:
- Query History document: A tabular representation of the query history.
- Preview pane: An area to view detailed query information.
The Query History document includes the following columns:
- Status: The success or failure of the query execution.
- Query Text: The text of a SQL query that was executed.
- Size (Bytes): The memory footprint of the query.
- Executed On: The exact time and date the query was run.
- Duration: The time it took for the query to execute.
- File: The name of the file containing the SQL statement.
- Server: The server on which the query was executed.
- User: The user who executed the query.
- Database: The name of the database where the query was run.
Query History filters
The tool allows for query filtering from the search box or by a set of filters available per column in the Query History document.
Filter queries from the search box
In the Search box, type the search string to find specific queries.
Filter queries per column
To open the filter window, select the filter icon in the upper-right corner of the column header:
![]()
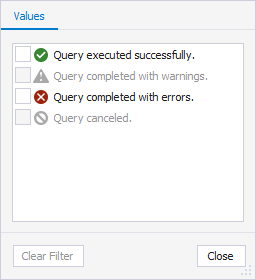
Status
Select the checkbox next to the query status to be displayed in the Query History document.
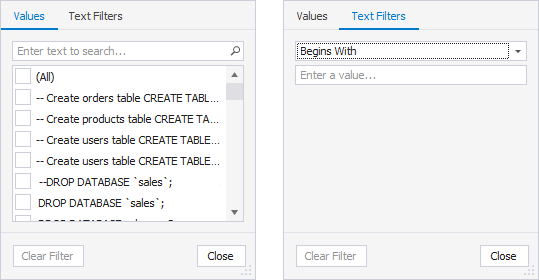
Query Text
Select the checkboxes next to the queries on the Values tab or choose the condition from the list and specify the value on the Text Filters tab.
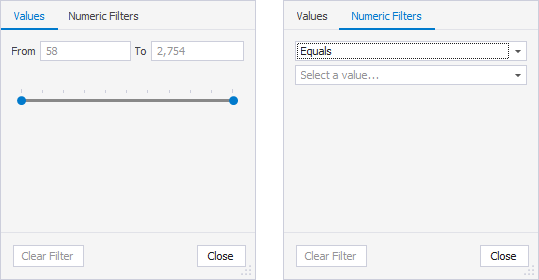
Size (in bytes)
Select the minimum and maximum values to filter the entries using the slider on the Values tab or choose the condition from the list and specify the value to the Numeric Filters tab.
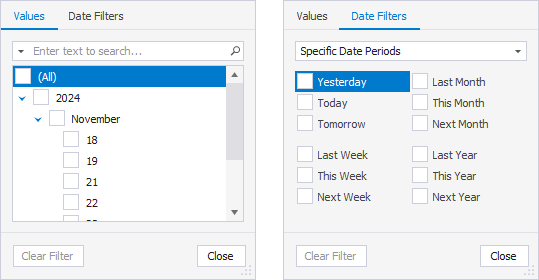
Executed On
Select the date range from the list on the Values tab or select the checkboxes next to the filter on the Date Filters tab.
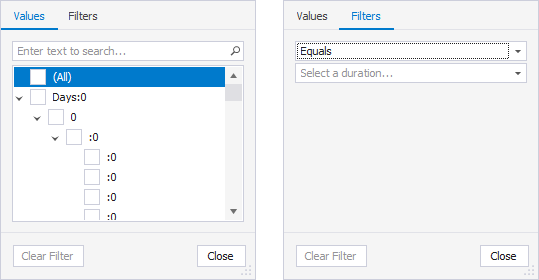
Duration
Select the query duration from the list on the Values tab or choose the condition from the list and specify the value on the Date Filters tab.
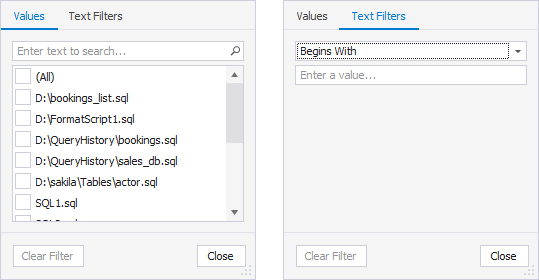
File
Select the checkbox next to the file on the Values tab or choose the condition from the list and specify the value on the Text Filters tab.
Server
Select the checkboxes next to the servers from the list on the Values tab or choose the condition from the list and specify the value on the Text Filters tab.
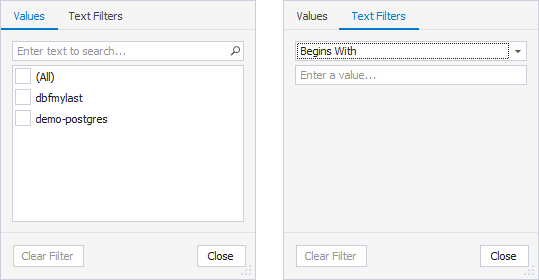
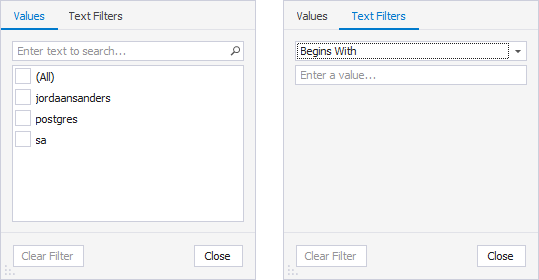
User
Select the checkboxes next to the user from the list on the Values tab or choose the condition from the list and specify the value on the Text Filters tab.
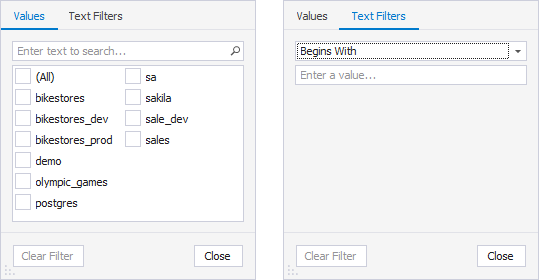
Database
Select the checkboxes next to the databases from the list on the Values tab or choose the condition from the list and specify the value on the Text Filters tab.
After configuring the filter, select Close. To remove the filter, select Clear Filter.
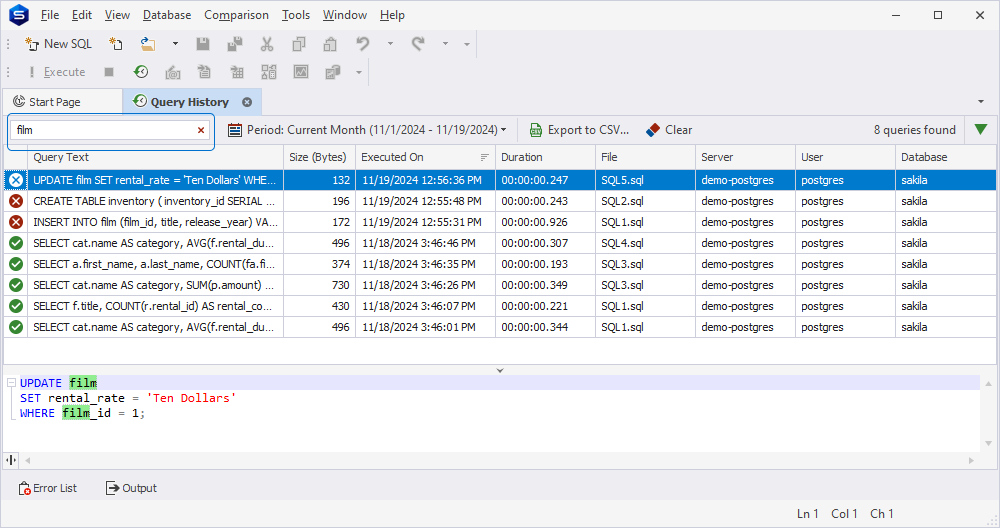
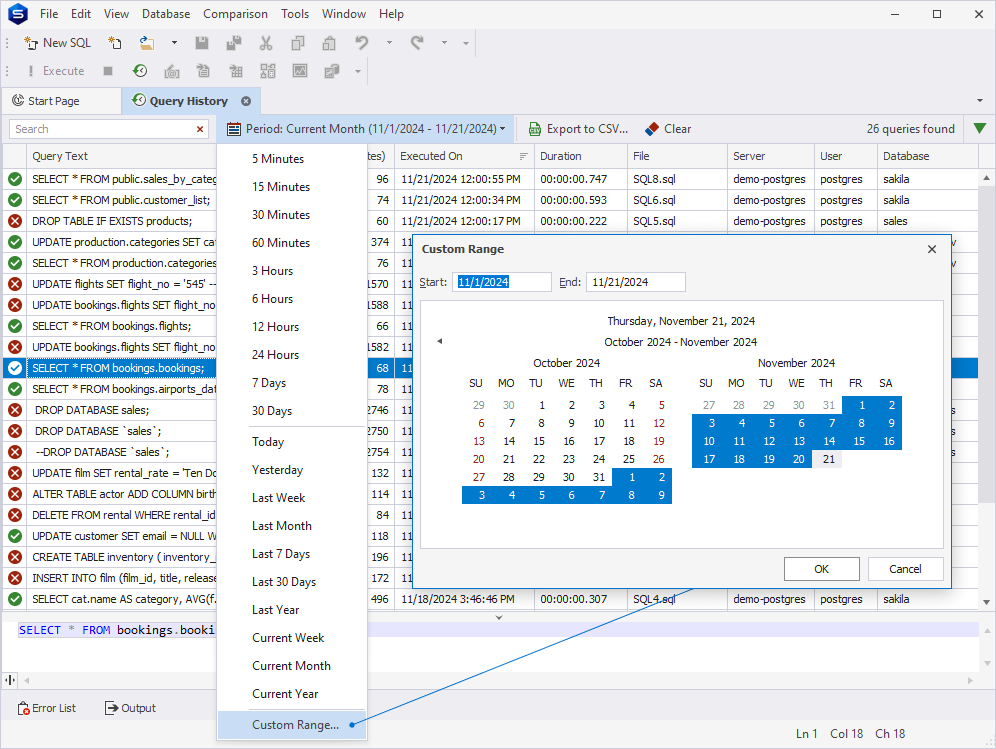
Filter queries by time period
From the Period list, select the required timeframe to filter queries by their execution period. To specify a custom timeframe, select Custom Range from the list.
In the Custom Range dialog that opens, set the time period and select OK.
Manage filters
The Studio allows adding, editing, or deleting filters using the Filter panel or the Editor Filter dialog.
Use the Filter panel
The Filter panel lets:
- View the applied filters
- Clear the checkbox to delete the filter
- Select the
 delete icon to remove the filter
Use the Editor Filter dialog
To open the Filter Editor dialog, select Edit Filter in the Filter panel.
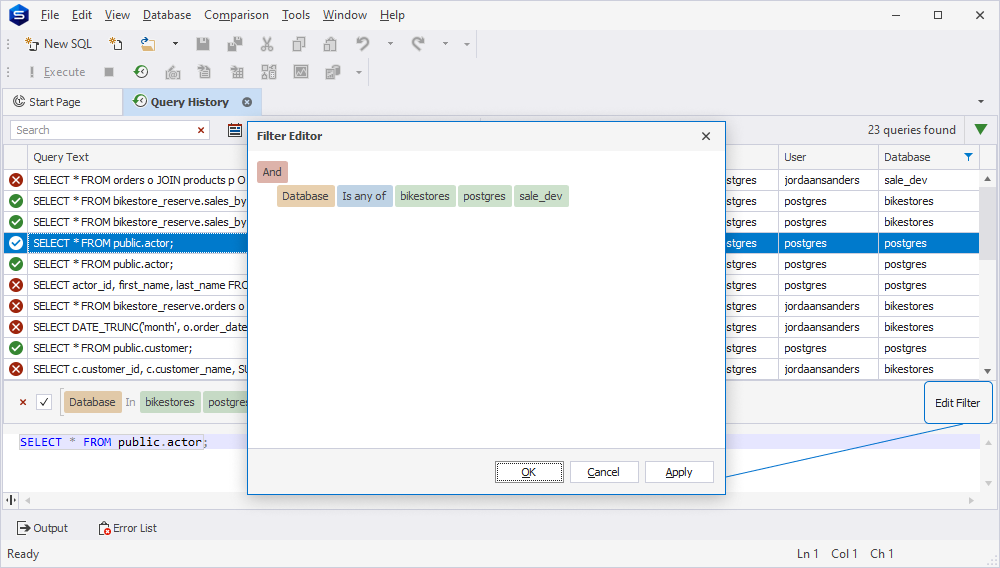
The Filter Editor dialog lets:
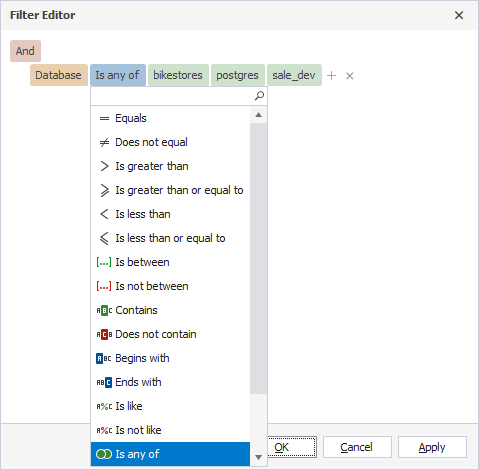
- Add or remove a filter condition
- Choose a relation type and enter a value to set up a filter condition
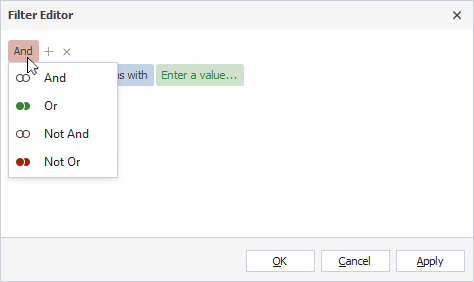
- Choose a logical operator. To change a group logical operator, click it and select another one from the menu.
- Add a condition or a group united with a logical operator. Then, choose a database, a relation type, and a value by which the queries will be filtered.
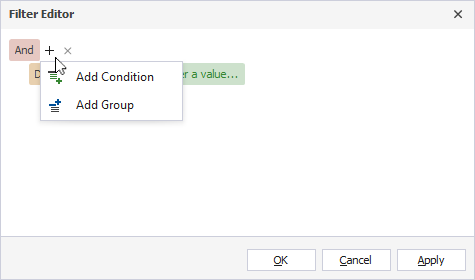
To apply the filter, select Apply. To discard the changes, select Cancel.
Use shortcut options
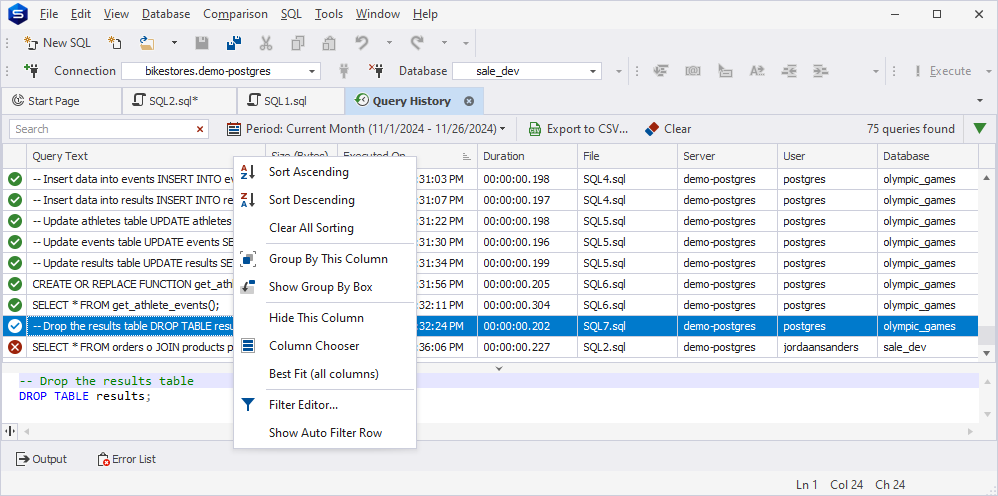
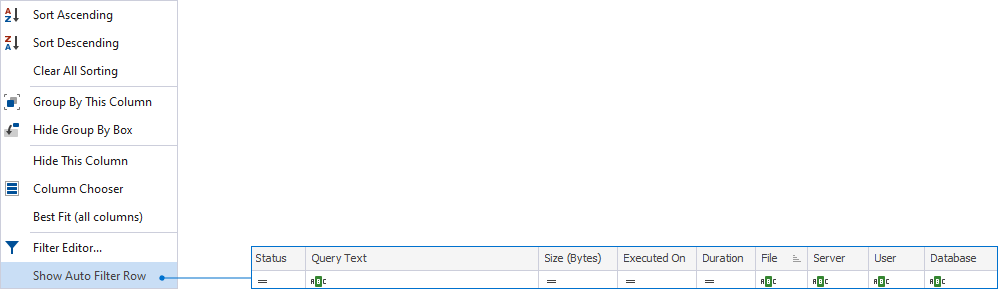
Right-clicking the column header will call the shortcut menu with the following options:
- Sort Ascending: Apply ascending sort order to the column
- Sort Descending: Apply descending sort order to the column
- Clear All Sorting: Reset sorting to default
- Group By This Column: Group queries by the selected column
- Show/Hide Group By Box: Drag a column to the Group By Box field to group data by that column
- Hide This Column: Hide the selected column
- Column Chooser: Open the Customization window to remove the columns from the Query History grid or add them back
- Best Fit (all columns): Ditto for all columns
- Filter Editor: Open the editor with filtering options
- Show/Hide Auto Filter Row: Show or hide a row to filter data directly from the grid
Note
Query History is stored in the ExecutedQueries.db file. To specify a path to the folder where this file will be stored, go to Tools menu > Options > Environment > Documents > Query History. The default path is %appdata%\Devart\dbForge Studio for PostgreSQL\ExecutedQueries.
Note that this file does not store your connection passwords.
Use the Customization window
The Customization window displays the column headers from the Query History grid. The window lets remove, sort, or manage the columns.
Remove columns from the Query History grid
1. On the Query History grid, right-click the column header and select Column Chooser to open the Customization window.
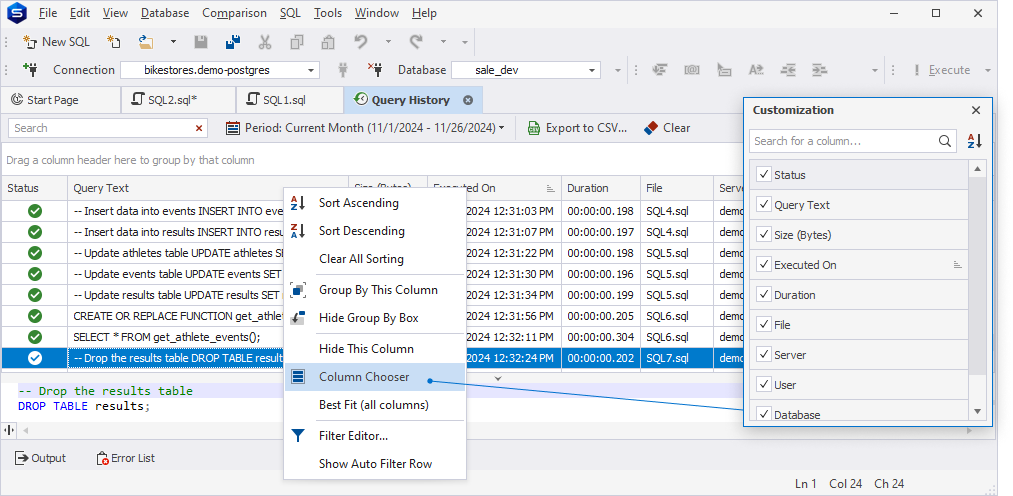
2. In the window, all the columns are selected by default. Clear the checkbox next to the column to remove the column from the grid.
Manage columns using options from the shortcut menu
Right-clicking the column will invoke the shortcut menu to manage columns on the grid.
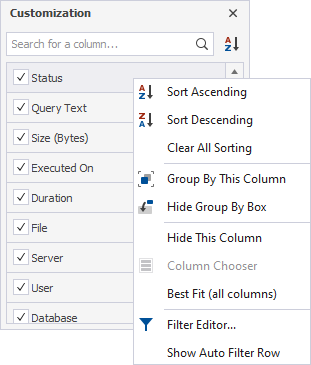
Sort queries by column
The sort glyph indicates the current sort order of a column. If the column is not sorted, the sort glyph is hidden. To remove sorting, select Clear Sorting.
![]()
Show/Hide Auto Filter Row
Right-click the column header and select Show Auto Filter Row.
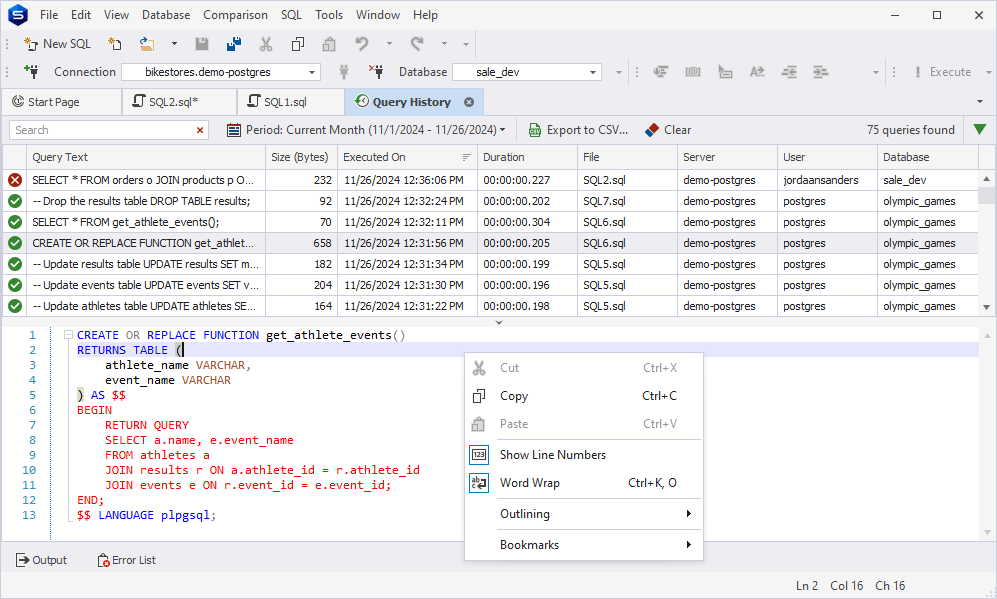
Manage the query text from the Preview pane
Navigate to the lower Preview pane that displays the text of the selected query.
To use the shortcut options, right-click anywhere in the Preview pane and select the required option.
Edit a query
The query can be edited as follows:
Way 1 - double-click the required query:
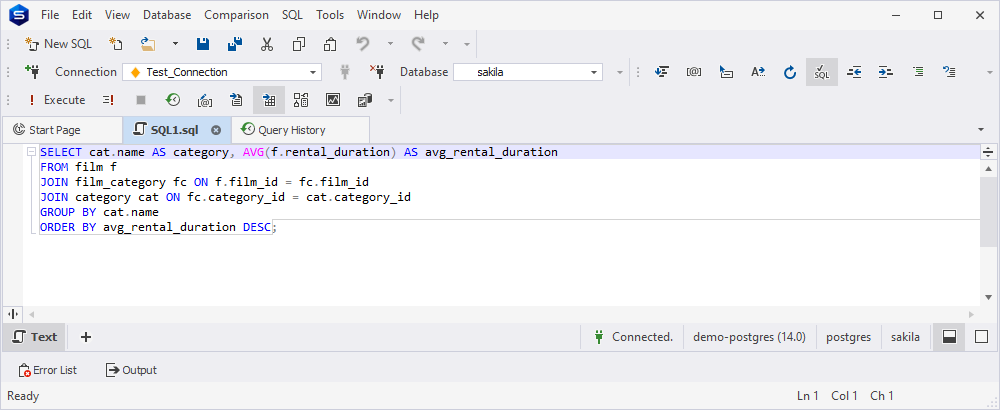
Double-click the required query in the Query History document. This will open the query in a new SQL document where you can edit and execute it.
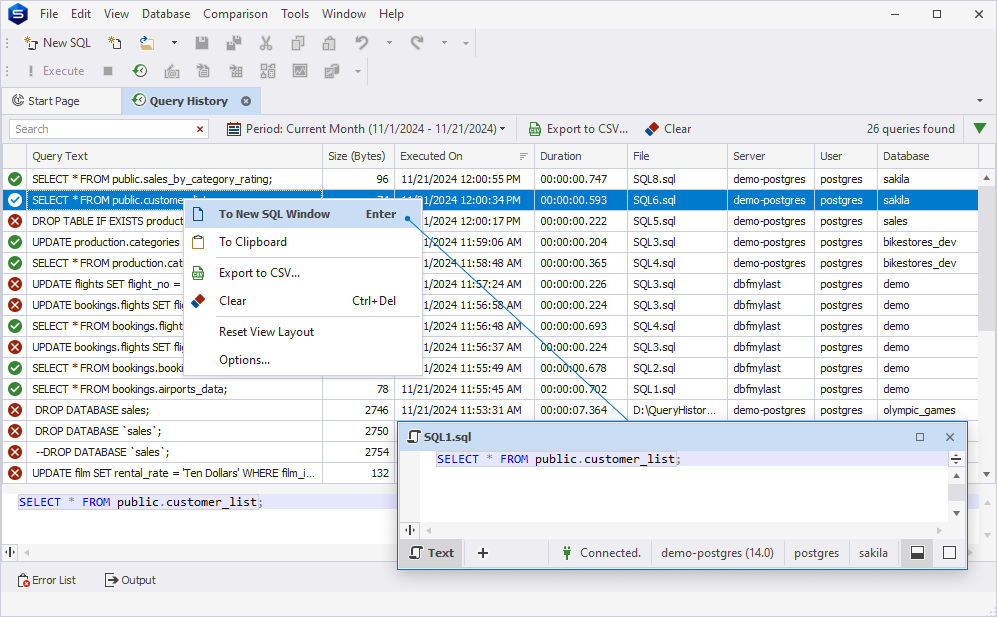
Way 2 - use the “To New SQL Window” option:
1. Select the required query and then right-click it.
2. From the shortcut menu, select To New SQL Window. The query will open in a new SQL document.
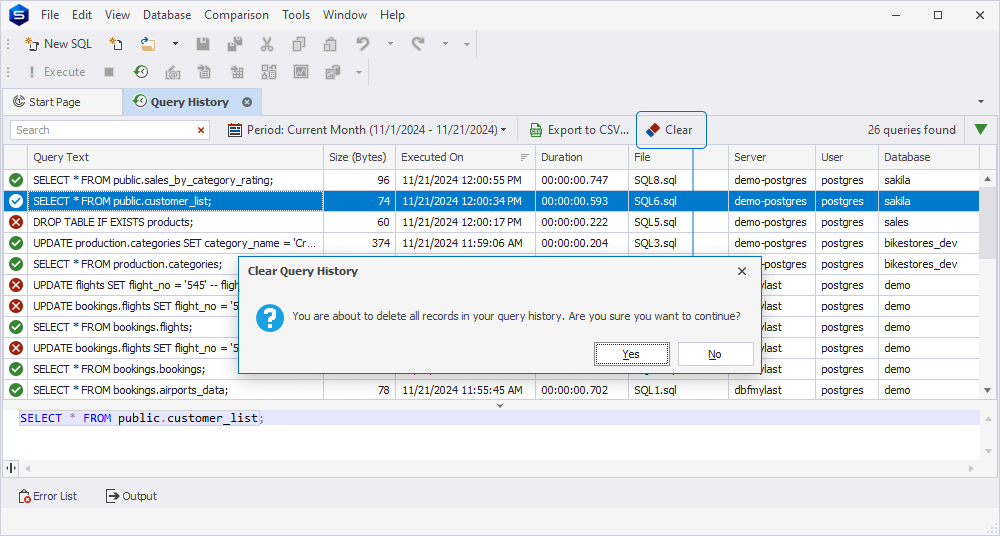
Clear the Query History
To clear the query history:
1. On the Query History document, select Clear or press Ctrl+Del.
2. A message appears notifying you that all records in the query history will be deleted.
3. Select Yes to confirm the deletion or select No to cancel it.
Configure the Query History settings
The Query History settings can be configured in the Options dialog. To open it, use one of the following ways:
- On the ribbon, select Tools > Options.
- In the upper-right corner of the Query History document, select
 and then select Options.
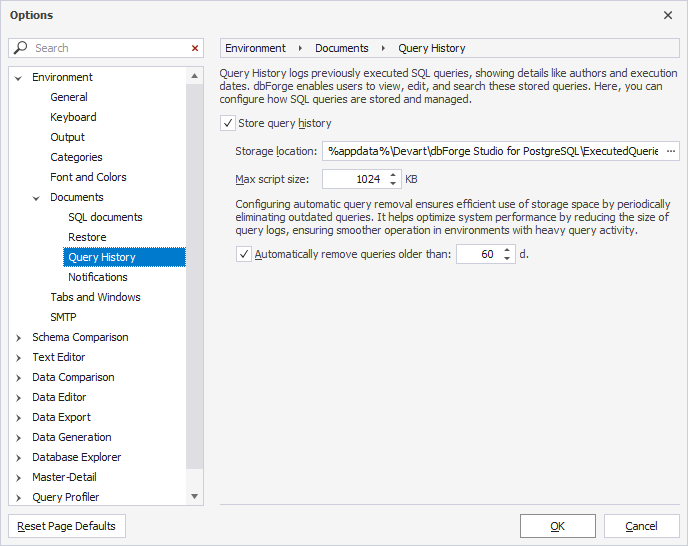
In the Options dialog, navigate to Environment > Documents > Query History to set up the Query History settings:
- Select Store query history to enable the storage of the query history. The option is selected by default.
- Modify the storage path for the Query History database and set the maximum script size to store.
- Automatically remove queries older than the specified period.
By default, the query history is saved in the following folder:
C:\Users\Username\AppData\Roaming\Devart\dbForge Studio for PostgreSQL\ExecutedQueries
where Username is the name of the current user.
The maximum script size is set to 1024 KB by default. Executed queries are stored for 60 days by default, while the maximum interval that can be set is 365 days. After the specified period has ended, the history is automatically deleted. You can also upload the file with the history data by copying the file from the storage folder to another location on your computer. However, note that these files cannot be reopened in the dbForge tool once the data has been automatically deleted.
To save the changes, select OK.
Reset view layout
To reset view layout, in the upper-right corner of the Query History document, select ![]() and then select Reset View Layout.
and then select Reset View Layout.