


Creating a Simple Data-Aware Report
Last modified: October 18, 2023
This topic will guide you through the process of creating a simple data-aware report with dbForge Studio for MySQL. You will learn how to bind a report to data, edit report bands, use the Data Source window to add report controls to the report and bind them to data, and also how to number pages in the report.
Note that it is recommended that you review the How To: Create a Static Report topic first. It will help you learn how to create a simple report with dbForge Studio.
-
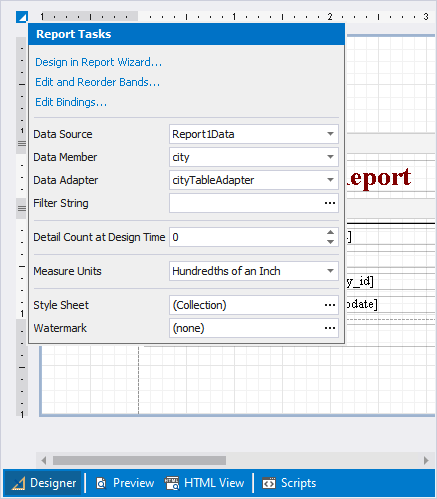
In this example, a report will be bound to data from the address data table of the Sakila database. To add the table to the report, simply drag it from Database Explorer to the Data Source window.
Now, your report is bound to data. The next steps show how to customize the report’s layout, and to specify which data fields should be used to provide data for report controls.
-
Click the top-left corner of the report designer to invoke the report’s smart tag. Choose the Edit and Reorder Bands… option in this list to edit the collection of report bands. For example, select the PageHeader band and remove it (it’s unnecessary for this report) but add the ReportHeader band:
Note
You can also use the Report Editor dialog box to change any other report band settings (e.g. the height of the PageFooter band).
- Drop a Label control from the Toolbox window onto the Report Header band (as you did in the *Creating a Static Report** topic) and set its Text to Customers’ Address List.
- Create two labels and set their Text properties to Phone: and Address: correspondingly.
- Create two labels bound to the address and phone data fields. To do this, simply drag the necessary data field items from the Data Source tree and drop them onto the report’s Detail band.
- To add page numbers to the bottom of each page in the report, drag the PageInfo item from Toolbox, and then drop it onto the PageFooter band. To change the format of page numbers shown in the report, invoke the control’s smart tag by clicking top-right corner of the control. For instance, set this property’s value to Current of Total Page Numbers.
-
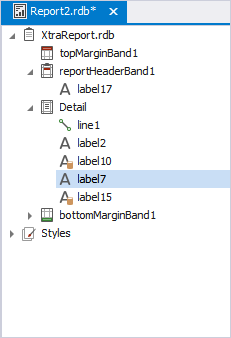
Now, you have a data-aware report. Its structure is shown on the right side of the report document. Note that bound controls are marked with yellow database icons:
- To use this report for creating a master-detail report by our tutorial, save this report by clicking Save Report1.rdb on the File menu.
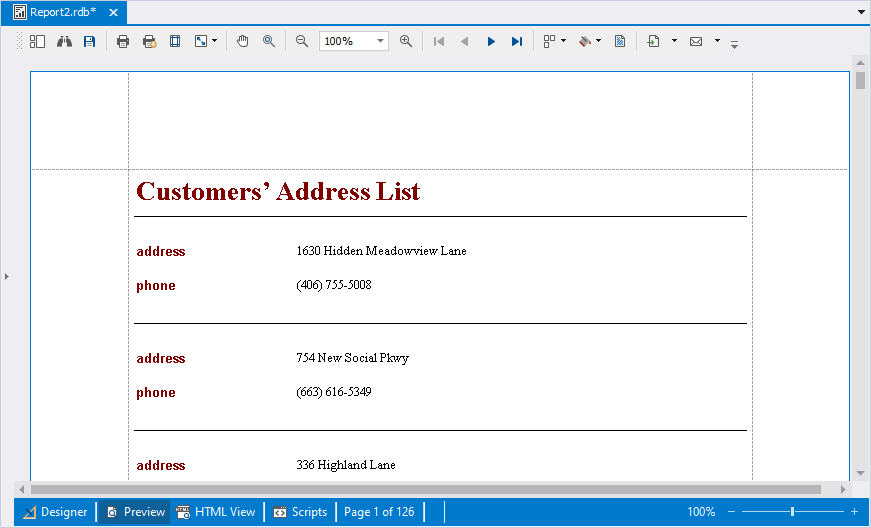
- Now, switch to the Preview tab at the bottom of the document area:
In this topic, you’ve created a simple report which is bound to data. You can now proceed to the Creating a Master-Detail Report topic to learn how to use Detail Report bands to create master-detail relationship reports.
'%3e%3cpath%20id='thumb_up_2'%20d='M15%2017H5.5V7L11.5%201L12.1667%201.45833C12.4028%201.625%2012.5833%201.83681%2012.7083%202.09375C12.8333%202.35069%2012.8681%202.61806%2012.8125%202.89583L12.7917%203L12%207H17.5C17.9167%207%2018.2708%207.14583%2018.5625%207.4375C18.8542%207.72917%2019%208.08333%2019%208.5V9.6875C19%209.79861%2018.9896%209.89931%2018.9688%209.98958C18.9479%2010.0799%2018.9167%2010.1736%2018.875%2010.2708L16.3944%2016.0875C16.2703%2016.3625%2016.0833%2016.5833%2015.8333%2016.75C15.5833%2016.9167%2015.3056%2017%2015%2017ZM7%2015.5H15L17.5%209.6875V8.5H10.1667L11.1875%203.4375L7%207.625V15.5ZM5.5%207V8.5H2.5V15.5H5.5V17H1V7H5.5Z'%20fill='%2327282C'/%3e%3c/g%3e%3c/g%3e%3c/svg%3e) Yes
Yes'%3e%3cpath%20id='thumb_down_2'%20d='M5%203H14.5V13L8.5%2019L7.83333%2018.5417C7.59722%2018.375%207.41667%2018.1632%207.29167%2017.9062C7.16667%2017.6493%207.13194%2017.3819%207.1875%2017.1042L7.20833%2017L8%2013H2.5C2.08333%2013%201.72917%2012.8542%201.4375%2012.5625C1.14583%2012.2708%201%2011.9167%201%2011.5V10.3125C1%2010.2014%201.01042%2010.1007%201.03125%2010.0104C1.05208%209.92014%201.08333%209.82639%201.125%209.72917L3.60417%203.91667C3.71528%203.63889%203.89931%203.41667%204.15625%203.25C4.41319%203.08333%204.69444%203%205%203ZM13%204.5H5L2.5%2010.3125V11.5H9.83333L8.8125%2016.5625L13%2012.375V4.5ZM14.5%2013V11.5H17.5V4.5H14.5V3H19V13H14.5Z'%20fill='%2327282C'/%3e%3c/g%3e%3c/g%3e%3c/svg%3e) No
NoWant to find out more?
'%3e%3cpath%20id='Vector'%20d='M4%204V24H24V4H4ZM22%2022H6V9H22V22ZM19%2019H9V18H19V19ZM19%2016H9V15H19V16ZM19%2013H9V12H19V13ZM21%202H2V21H0V0H21V2Z'%20fill='%230071CE'/%3e%3c/g%3e%3cdefs%3e%3cclipPath%20id='clip0_676_40052'%3e%3crect%20width='24'%20height='24'%20fill='white'/%3e%3c/clipPath%3e%3c/defs%3e%3c/svg%3e)
Overview
Take a quick tour to learn all about the key benefits delivered by dbForge Studio for MySQL.

All features
Get acquainted with the rich features and capabilities of the tool in less than 5 minutes.

Request a demo
If you consider employing this tool for your business, request a demo to see it in action.

