Debugger overview
Transact-SQL debugger was deprecated in Microsoft SQL Server Management Studio 18.0 and the functionality is no longer available. SQL Complete delivers one of the most important tools for developers - Debugger - right into SSMS.
T-SQL debugger that integrates with SQL Complete into Microsoft SQL Server Management Studio, is a powerful tool allowing you to observe the run-time behavior of your database objects and locate logic errors. With the debugger, you can break, or suspend, the execution of your program to examine a database object, evaluate and edit variables in your script directly in the IDE.
The integration of SQL Complete into SSMS delivers the Debug menu with access to debugger tools. Debugger windows and dialog boxes display information about your database object and enable you to enter additional information.
The SQL Complete debugger helps you perform the following debugging tasks in a debug mode:
- Step through the code using the following options:
- Continue to proceed with the debugging process until it reaches the next breakpoint or the end of the debugging process.
- Step into to instruct the debugger to go through the statements one by one. If the line contains a function call, Step Into executes only the call itself, then stops at the first line of the code inside the function.
- Step over to move the cursor to the next line of the executable script. Also, the command can be used to avoid stepping into functions.
- Step out to return to the script that calls the stored procedure (in case you are inside the stored procedure).
- Set a breakpoint on any line of executable code. A breakpoint is used to inform a debugger to stop or pause the execution at a certain point.
- View information about the current execution state using the following windows:
- The Results and Messages panes display information about the previously executed statements.
- The Output pane displays messages related to the actions running in the debugger.
- The Watches pane displays information about server and session variables, their value, and type. Expressions with variables and constants, such as
@a - @bor@a - 1, are not supported. - The Call Stack pane displays the function or procedure calls that are currently on the stack. The yellow arrow refers to the line of the code where the debugger is currently located.
- The Breakpoints pane displays all breakpoints you set in the code and their properties. Here you can delete, enable or disable breakpoints, or go to the source code.
To learn how to configure debugging settings, see Debugging options.
Requirements for starting the Debugger
Note
Starting with SSMS version 21, SQL Complete is not added to the menu bar by default. You can manually add it.
To add SQL Complete to the SSMS menu bar:
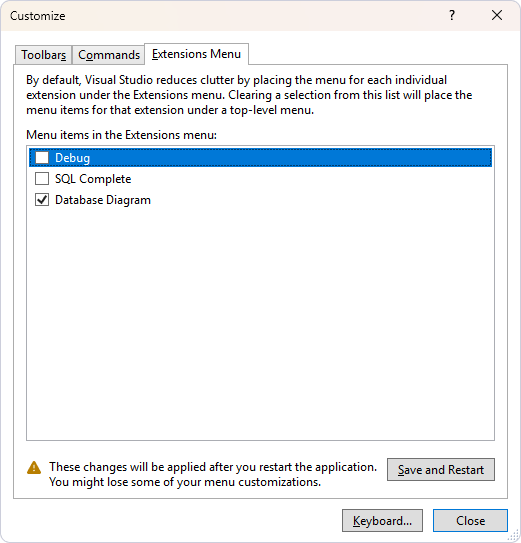
1. Navigate to Extensions and select Customize Menu.
2. In the Customize > Extensions Menu dialog that opens, clear the checkboxes next to SQL Complete and Debug.
3. Select Save and Restart.
4. In the confirmation dialog, select Yes to apply the changes.
When you attempt to start the Debugger, the following requirements should be fulfilled:
- Server-side and client-side components of T-SQL Debugger must be installed
- Debugging Firewall exceptions on the client and server sides must be enabled
- The Database Engine SQL document must be connected using the Windows Authentication or SQL Server Authentication under the login that is a member of the sysadmin fixed server role
- The Database Engine SQL document must be connected to a Database Engine instance of SQL Server 2005 SP2 or later. You cannot run the Debugger when the SQL document is connected to an instance that is in the single-user mode
Note
The T-SQL Debugger is not compatible with Microsoft Azure SQL databases. If you want to utilize the SQL Complete Debugger functionality, it is advisable to install SQL Server, including the Express edition, on your local PC. Additionally, you should copy your database from Azure SQL to the local SQL Server and launch debugging on it.
For more information about how to configure the debugger, see Configure the Debugger.
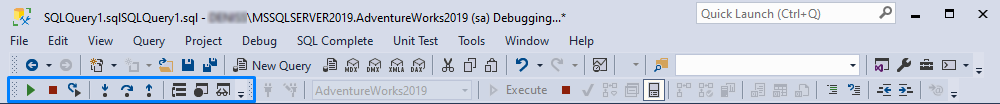
Debugger toolbar
When you start debugging, a toolbar appears allowing you to manage the process of debugging quickly and easily.
Note
It is recommended to debug Transact-SQL code on a test server, not a production one. Debugging sessions may take much time and thus the locks acquired by those sessions may be held for extended periods of time.
Video tutorial
Watch the video tutorial to learn how to debug code and scripts using SQL Complete in SSMS.