Configure the Debugger
If you are unable to attach the Transact-SQL Debugger, you need to:
- Ensure that the server-side and client-side components of the T-SQL Debugger are installed
- Enable debugging Firewall exceptions on the client and server sides
- Check that the login is a member of the sysadmin fixed server role
- Check that a database is not in the single-user mode
- Check that the ssdebugps.dll library file is installed on your PC
- Check that the COM object is registered in the x32 directory
Note
The T-SQL Debugger is not compatible with Microsoft Azure SQL databases. If you want to utilize the SQL Complete Debugger functionality, it is advisable to install SQL Server, including the Express edition, on your local PC. Additionally, you should copy your database from Azure SQL to the local SQL Server and launch debugging on it.
Ensure that the server-side and client-side components of the T-SQL Debugger are installed
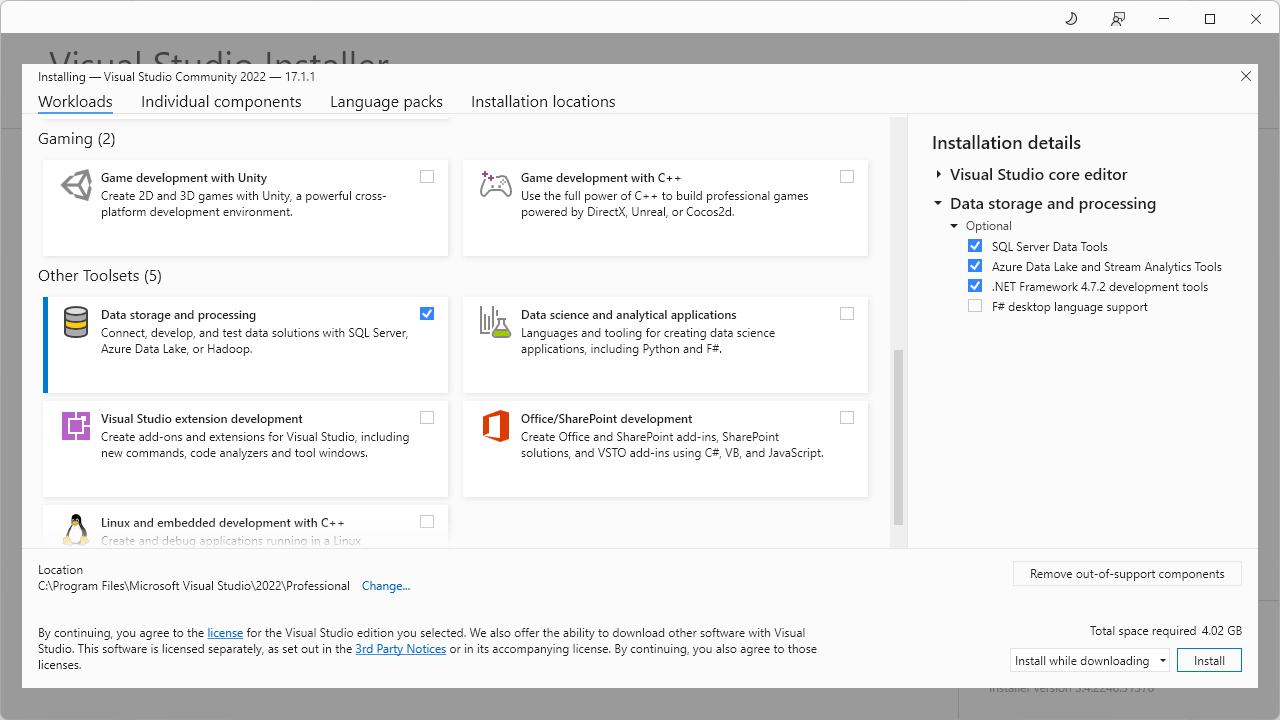
Server-side tools are a part of the SQL Server installation. Client-side tools are not delivered with SSMS and you need install them separately. You can install the client-side tools with SSDT, a new version of which is provided by the Visual Studio Installer.

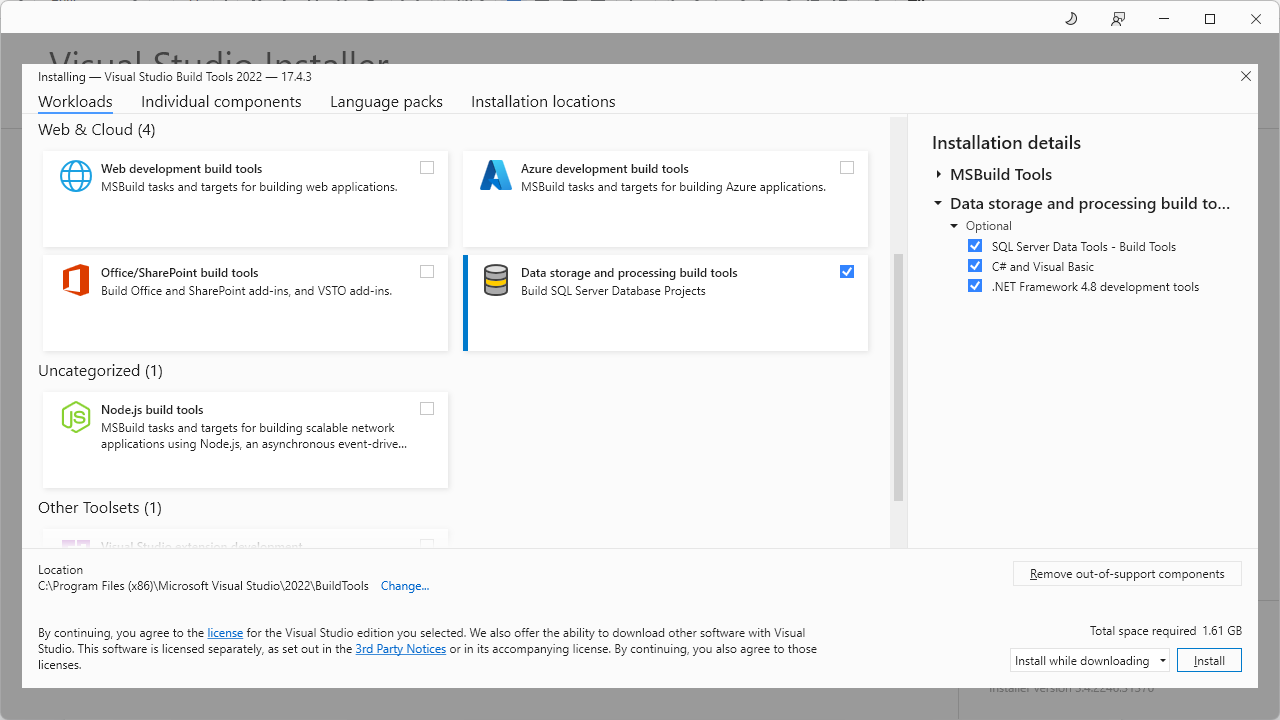
If you don’t use Visual Studio and want to have the minimal installation package, you can download Build Tools for Visual Studio 2022 in order to install Data storage and processing build tools:

Enable debugging Firewall exceptions on the client and server sides
To enable debugging Firewall exceptions on the server side:
Open PowerShell by pressing Win+R and run the following commands, but replace C:\Program Files\Microsoft SQL Server\MSSQL13.InstanceName\MSSQL\Binn\sqlservr.exe with your path to sqlservr.exe and 1.1.1.1 with your relevant IP:
New-NetFirewallRule -DisplayName "Allow SQLDebugger" -Direction Inbound -Action Allow -Program "C:\Program Files\Microsoft SQL Server\MSSQL13.InstanceName\MSSQL\Binn\sqlservr.exe" -Profile Any -Protocol TCP -LocalPort RPC

New-NetFirewallRule -DisplayName "Allow SQLDebugger SVCHost" -Direction Inbound -Action Allow -Program "%systemroot%\System32\svchost.exe" -Profile Any -Protocol TCP -LocalPort RPCEPMap

New-NetFirewallRule -DisplayName "Allow Client IP" -Direction Inbound -Action Allow -RemoteAddress 1.1.1.1 -Profile Any -Protocol TCP
To enable debugging Firewall exceptions on the client side:
Open PowerShell. For this, press Win+R and execute:
New-NetFirewallRule -DisplayName "Allow SQLDebugger SVCHost" -Direction Inbound -Action Allow -Program "%systemroot%\System32\svchost.exe" -Profile Any -Protocol TCP -LocalPort RPCEPMap
If you use SSMS, it’s required to run the following command, but replace C:\Program Files (x86)\Microsoft SQL Server\130\Tools\Binn\Management Studio\ssms.exe with your path to ssms.exe:
New-NetFirewallRule -DisplayName "Allow SQLDebugger SSMS" -Direction Inbound -Action Allow -Program "C:\Program Files (x86)\Microsoft SQL Server\130\Tools\Binn\Management Studio\ssms.exe" -Profile Any -Protocol TCP -LocalPort RPC
In case you use SQL Server Data Tools, execute the following command, but replace C:\Program Files (x86)\Microsoft Visual Studio 11.0\Common7\IDE\devenv.exe with your path to devenv.exe:
New-NetFirewallRule -DisplayName "Allow SQLDebugger SSMS" -Direction Inbound -Action Allow -Program "C:\Program Files (x86)\Microsoft Visual Studio 11.0\Common7\IDE\devenv.exe" -Profile Any -Protocol TCP -LocalPort RPC
Check that the login is a member of the sysadmin fixed server role
In SSMS, click New Query, enter the following statement, and click Execute:
SELECT name, type_desc, is_disabled
FROM master.sys.server_principals
WHERE IS_SRVROLEMEMBER ('sysadmin',name) = 1
ORDER BY name;
GO
If the login is not a member of the sysadmin fixed server role, you can execute the following statement in SSMS, but replace UserName with your username:
EXEC sp_addsrvrolemember 'UserName', 'sysadmin';
GO
Check that a database is not in the single-user mode
In SSMS, click New Query, run the following command, but replace YourDb with your database:
IF (SELECT user_access_desc FROM sys.databases WHERE name = 'YourDb') = 'SINGLE_USER'
    BEGIN
       PRINT 'It is in single-user mode!'
    END;
GO
If the database is in the single-user mode, you need to switch it to the multi-user mode. For this, proceed with the following steps:
1. Check all active users in SSMS. Click New Query, enter the following statement, and click Execute:
sp_who2
This statement returns all session IDs of the users that are required for the next command.
2. Disconnect all sessions of the connected users, but replace session_id with the session ID of the process you want to end:
KILL <session_id>
3. Change the mode for the database, but replace YourDB with the required database in the command:
USE [master];
GO
ALTER DATABASE [YourDB] SET MULTI_USER;
GO
Check that the ssdebugps.dll library file is installed on your PC
The Transact-SQL debugging feature works with SSMS version 17.9.1 and earlier and is also available in SQL Server Data Tools (SSDT) for Visual Studio. For later SSMS versions, Microsoft has discontinued support for the debugger and does not provide a 32-bit version of the ssdebugps.dll library file.
Note
If you use SSMS v.21, you don’t need to install the
ssdebugps.dllfile.
To enable the debugger, you need to install and re-register the ssdebugps.dll library file by following the steps:
1. Check that the ssdebugps.dll file is stored at C:\Program Files (x86)\Common Files\Microsoft Shared\SQL Debugging (for SSMS) or C:\Program Files (x86)\Common Files\Microsoft Shared\SQL Debugging\SSDT version (for example, 120 or 130)* (for SSDT VS).
2. If the ssdebugps.dll file is missing, copy it from another computer with SQL Server or Visual Studio installed to your PC. The file can be found in the following directory – \Program Files (x86)\ Common Files\Microsoft Shared\SQL Debugging.
3. In the search panel of your computer, type %windir%\SysWoW64\cmd.exe and run it as an administrator.
Note
Make sure to use the x32 version of cmd.exe.
4. In the Command Prompt, execute the following command to navigate to the directory where the ssdebugps.dll file is located.
cd "C:\Program Files (x86)\Common Files\Microsoft Shared\SQL Debugging"
5. Execute the following command to re-register the file:
regsvr32 ssdebugps.dll
You should get the DllRegisterServer in ssdebugps.dll succeeded. message.
Note
T-SQL Debugger is fully compatible with Virtual Private Networks allowing you to seamlessly debug queries even when connected through VPN.
Check that the COM object is registered in the x32 directory
When configuring the debugger, you may encounter the Unable to attach the Transact-SQL Debugger error.
In addition to verifying that both server-side and client-side components are installed, firewall exceptions are enabled, and your database is not in single-user mode, you should also check whether the COM object is registered in the x32 directory.
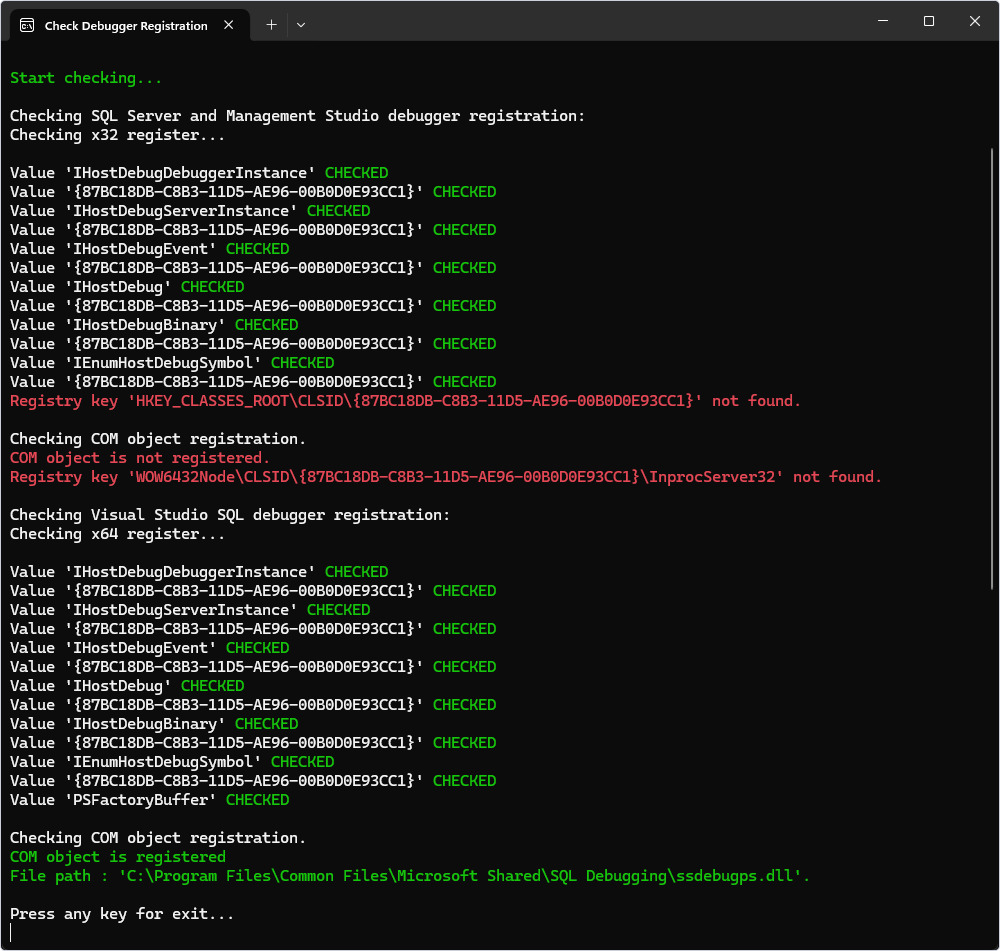
For this, you can use the CheckDebugger application created by Devart to check the SQL Debugger registration.
1. Download the CheckDebugger.zip archive and unpack it.
2. Run the CheckDebugger.exe file.
The application does not gather or send any information. It only checks your register and filesystem for specific information on SQL Debugger.

3. If you agree to these terms, press Enter.

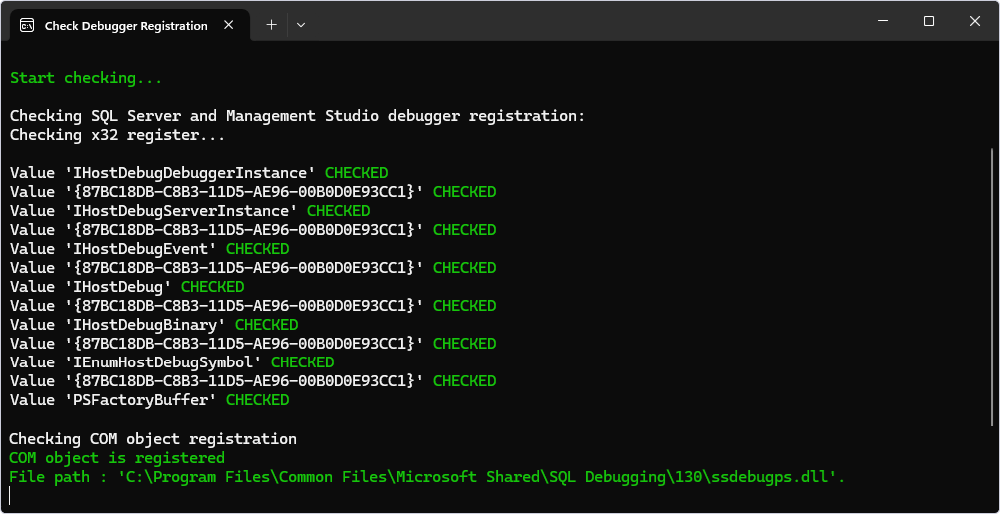
If you do not have a registered COM object for the ssdebugps.dll library, create it as described in the previous section. Double-check the COM object creation by running CheckDebugger again. You should get the following response:
