How to debug a trigger
This tutorial describes the steps to debug a trigger with the help of T-SQL Debugger built into dbForge SQL Complete. For demo purposes, we are going to use the DELETE statement for the Purchasing.Vendor table from the AdventureWorks2019 database.
Note
Starting with SSMS version 21, SQL Complete is not added to the menu bar by default. You can manually add it.
To add SQL Complete to the SSMS menu bar:
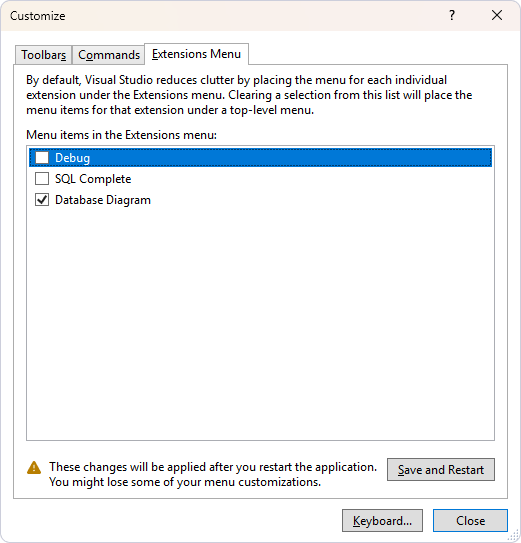
1. Navigate to Extensions and select Customize Menu.
2. In the Customize > Extensions Menu dialog that opens, clear the checkboxes next to SQL Complete and Debug.
3. Select Save and Restart.
4. In the confirmation dialog, select Yes to apply the changes.
To debug a trigger:
1. On the standard toolbar, click New Query.
2. In the query window that opens, type the DELETE statement for the table containing the trigger you want to debug.
DELETE Purchasing.Vendor WHERE BusinessEntityID = 1630
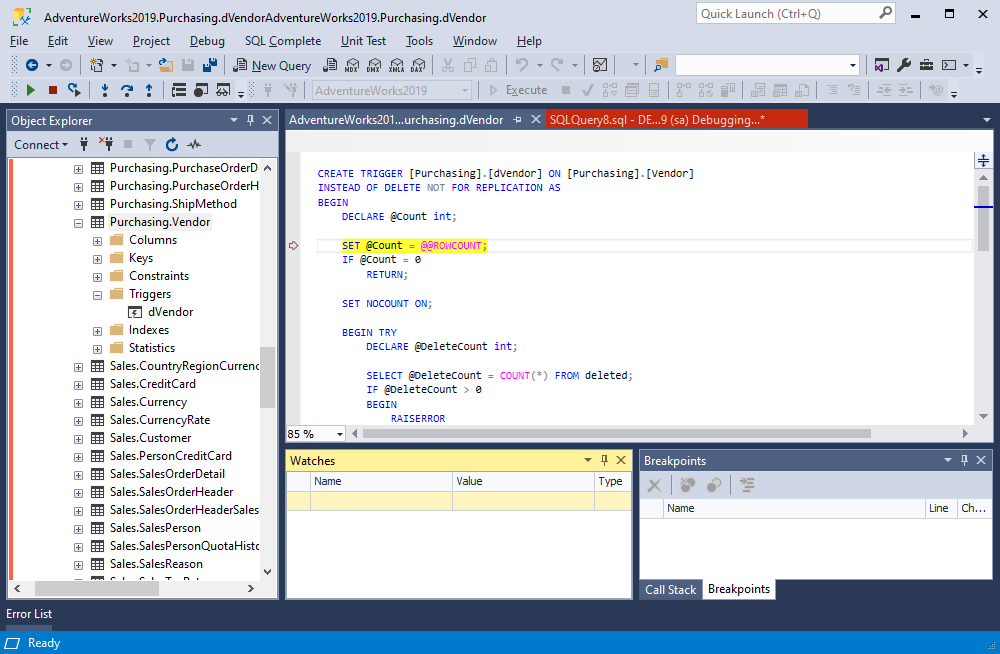
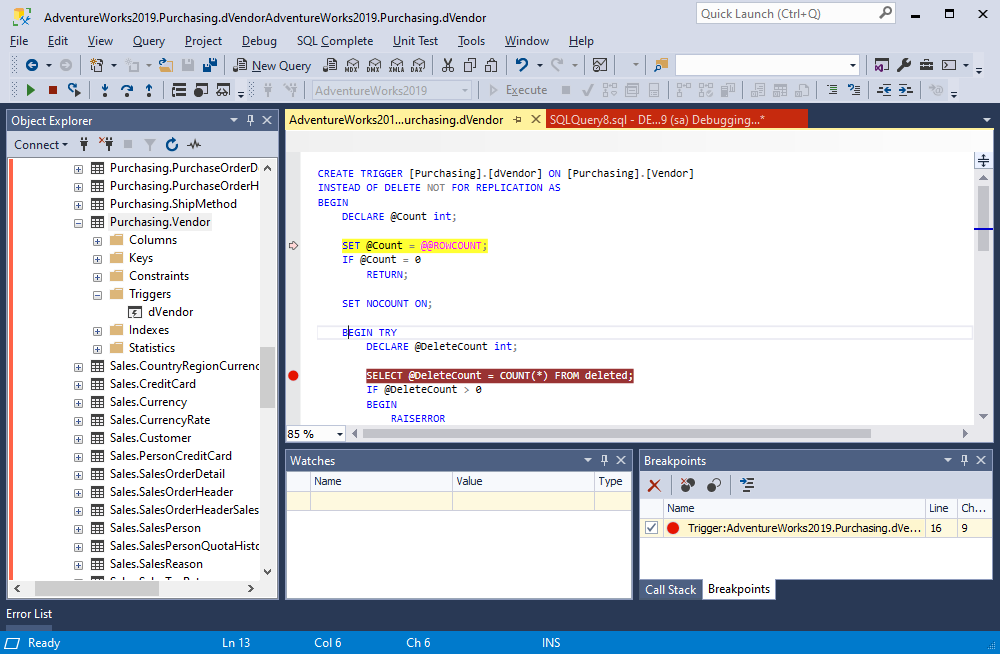
3. In the Debug menu, click  Step Into or press F11 until a new SQL document with the CREATE statement for the trigger opens.
Note
The yellow arrow identifies the stack frame where the execution pointer is currently located.
You can view the value of the variable by hovering over the variable in the query. The quick info tip will be displayed. However, be sure that the Enable code completion feature is selected in SQLComplete > Options > General.
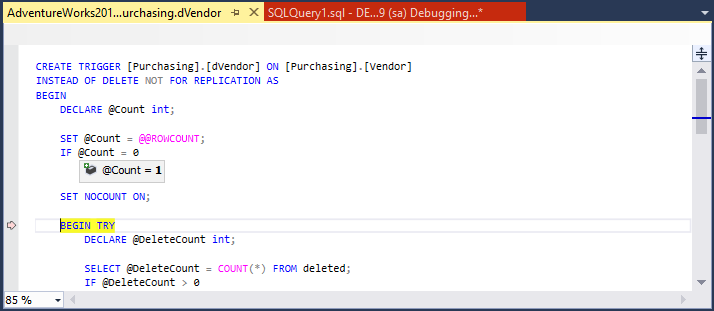
4. In the CREATE statement document, insert a breakpoint by using one of the following options:
- Right-click the line of the code where you want to set a breakpoint and select Insert Breakpoint.
- Place a cursor on the line of the code you want to break on, navigate to the Debug menu, and select Toggle Breakpoint or press F9.
- Click on the gray bar to the left of the code where you want to insert a breakpoint.
In the SQL query editor, the line with the breakpoint will be highlighted with the red color.
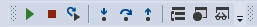
5. On the Debug toolbar, click ![]() Continue or press Alt+F5.
Continue or press Alt+F5.
After you do it, the Breakpoints pane opens where you can view breakpoints set in the code and manage them as follows:
- Delete the selected breakpoint by clicking
 Delete
 - Delete all breakpoints by clicking
 Delete All Breakpoints
 - Disable all breakpoints by clicking
 Disable All Breakpoints
 - Switch to the source code by clicking
 Go to Source Code
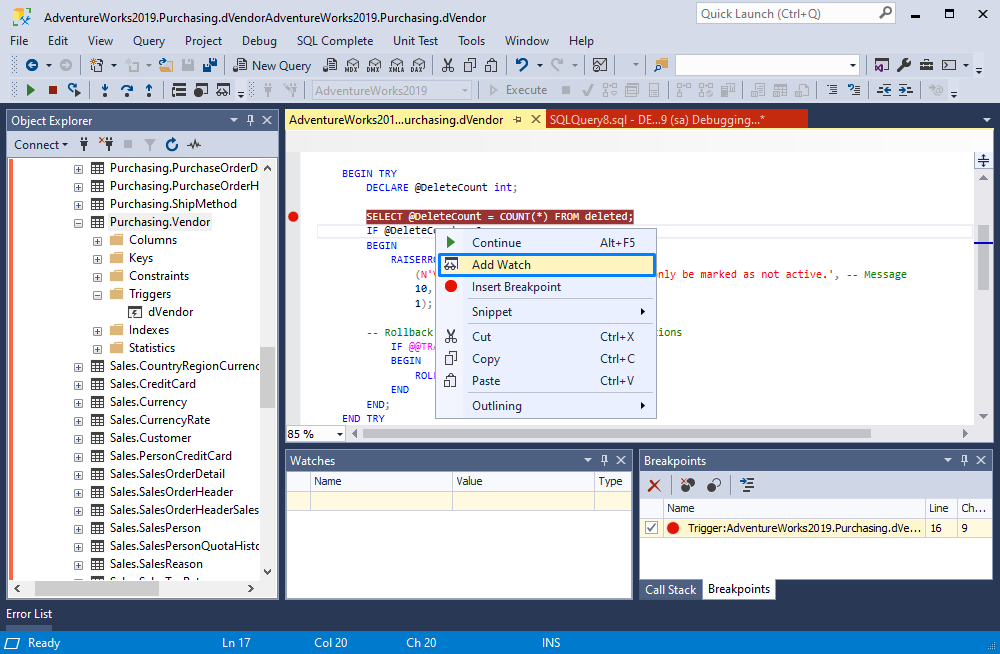
6. Add the variable to the Watches pane. To do that, right-click the variable and then select Add Watch.
Note
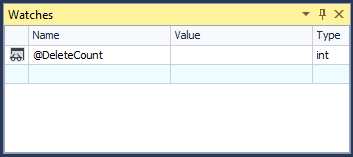
The Watches pane displays variables, their values, and types (values of variables being tracked).
To delete a watch, in the Watches pane, right-click the watch and select Delete Watch.
7. On the Debug toolbar, click ![]() Continue or press Alt+F5.
Continue or press Alt+F5.
Alternatively, click Step Into or press F11 repeatedly to step through the trigger.
8. To stop debugging, use one of the following options:
- On the Debug menu, select Stop debugging or press Shift + F5.
- On the Debugger toolbar, click
 Stop Debugging.
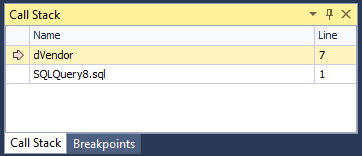
Call Stack browsing
The Call Stack pane displays the line of the code where the debugger is currently located.
In the Call Stack pane, there are two database objects: the trigger and the procedure. The yellow arrow next to the trigger indicates the stack frame where the execution pointer is currently located. The green arrow indicates that you have stepped back to the parent code that has called the trigger. You can get back to the procedure source code. To do that, double-click the procedure in the Call Stack pane.