Visualizers are enhancements of the Visual Studio debugger, used for viewing certain type of objects in Debug mode. A visualizer creates a dialog box or another interface to display an object or variable in a manner that is appropriate to its data type. You can read more about visualizers in MSDN.
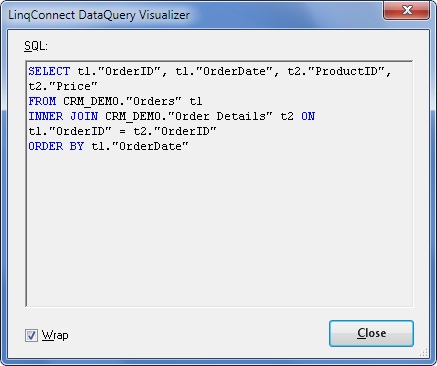
LinqConnect includes a visualizer for DataQuery objects, that allows you to view a generated SQL command for the LINQ statement in a dialog box. SQL syntax highlighting provides more comfortable reading.
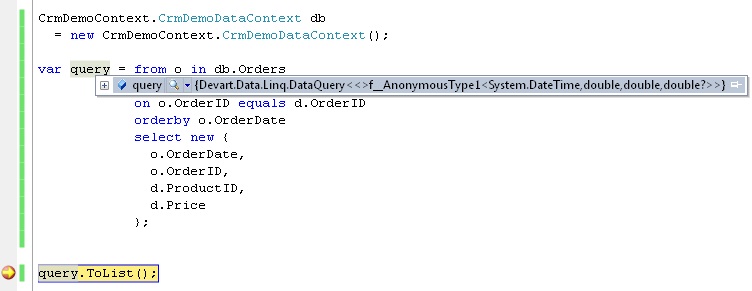
For example, we have the following LINQ statement:
You can call a visualizer window from a debugger variables window, or from the QuickWatch dialog box with the help of magnifying glass icon while debugging. Point to the query and click the magnifying glass to select a visualizer appropriate to the LINQ statement.
The visualizer window contains SQL-command corresponding to the LINQ-statement described above:
Also, you can use other visualizers for different cases of project debugging.
 Note: Note: |
|---|
|
Note, that debugger visualizers need greater privileges than are allowed by a partial trust application. So, visualizers do not load when you are stopped in code with partial trust. You must run the code with full trust to view visualizer. |