What is Pivot Table?
Data analysis is not always a snap. You can look at the same data from different angles and only some of them can bring valuable information. When dealing with data, one often beats his brains with grouping, sorting, or doing anything else to get required results and grasp the whole picture. Pivot Table is designed exactly to end these miseries and enable you to fisk any obscure data with several mouse clicks. It’s possible to be a data-management guru with Pivot Table.
Pivot Table is a tool that converts large amounts of data into compact and informative summaries - pivot tables. You can rearrange (or pivot) your data by a simple drag of a mouse until you get the layout best for understanding the data relations and dependencies.
Pivot Table in Use
Let’s take the Sakila database, retrieve some data for analysis, and create a pivot table to see its benefits.
Note
As the original Sakila database contains a huge number of table records, they were cut down to half to illustrate the example.
Suppose you are interested in monthly and yearly income of the stores based on film rental amounts in each film category. You would like to know which of film categories are more profitable to improve the range of films. The main data is stored in Payment table, other tables are required to get full names of film categories and film titles.
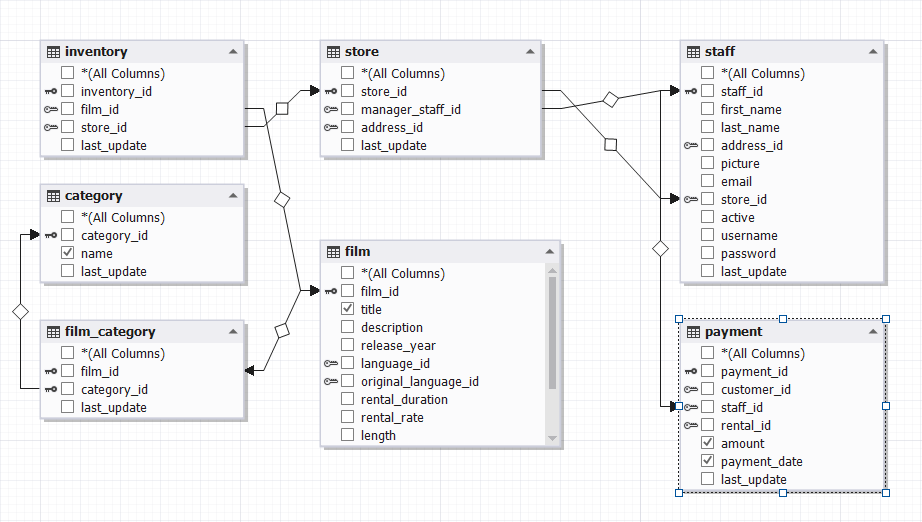
To get required data from the tables, you should select the following fields and build a query using the Query Builder:
- title from Film table
- name from Category table
- amount and payment_date from Payment table
This is what you should have received after executing the query. The usual grid will display the data the same way.
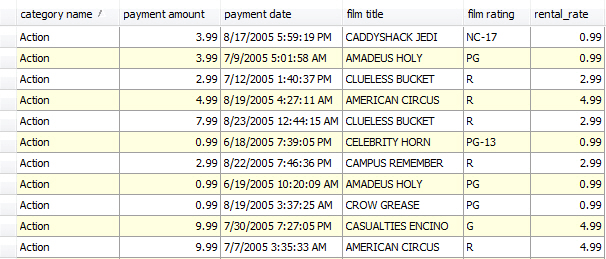
To analyze which film category had more rentals and brough the highest revenue in each particular month, you should sum up and then compare rental amounts of each film category. This way is time-consuming and often followed by errors.
Let’s see how data can be displayed in a pivot table. To create a pivot table, you need to open the Pivot Table view of the SQL document and drag the required fields from the Data Source window (which opens automatically with the list of fields specified in the query) into required areas in a pivot table. The Pivot Table view contains the pivot table areas, so it’s easy to understand how the dragged fields will be displayed.
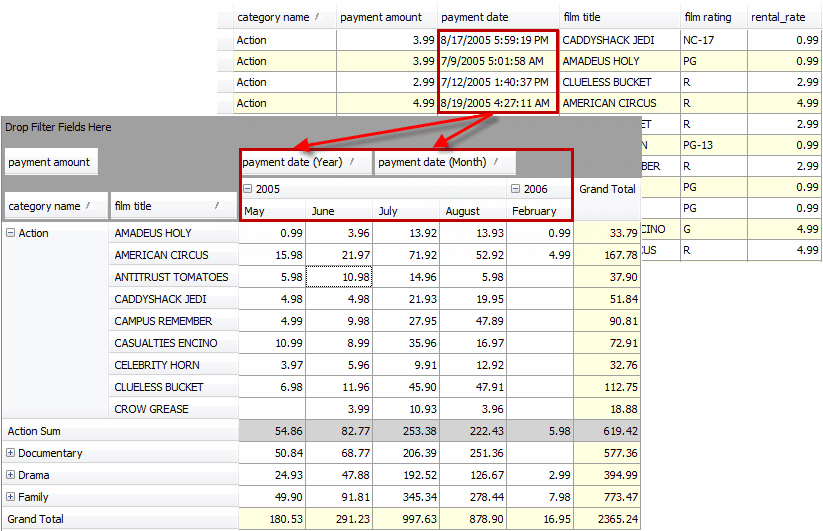
Now, following the tips, let’s drag amount field into the Data area, category name and film field to the Row area, and payment date to the Column area.
Note
PivotGrid automatically decomposes any fields of date or time type, so you can see payment date field decomposed into year, month, and day fields.
Let’s drag only year and month. Sum of all values as well as grand total values are automatically calculated for each row and column in the pivot table.
Now you have the following neat summaries:
- Sums of rentals for each film category by month and by year
- Sums of rentals for each film title by month and by year
- Grand Total values for each film category and each film title by month and by year
You can collapse Category nodes and easily compare the sums of rentals, that’s all.