What is Pivot Table?
Pivot Table is a tool that converts large amounts of data into compact and informative summaries - pivot tables. You can rearrange (or pivot), summarise, or group your data by a simple drag of a mouse until you get the layout best for understanding the data relations and dependencies. In pivot tables, you can drag data from the Data Source pane to the main fields of the pivot table, thus, choosing their positioning, rows, and columns.
Using a Pivot Table
Let’s retrieve some data for analysis and create a pivot table. For an example, we will use the Sakila database.
Suppose we need to retrieve monthly and yearly income of the stores based on film rental amounts in each film category. We need to know which of film categories are more profitable to improve the range of films. The main data is stored in the Payment table, other tables are required to get full names of film categories and film titles.
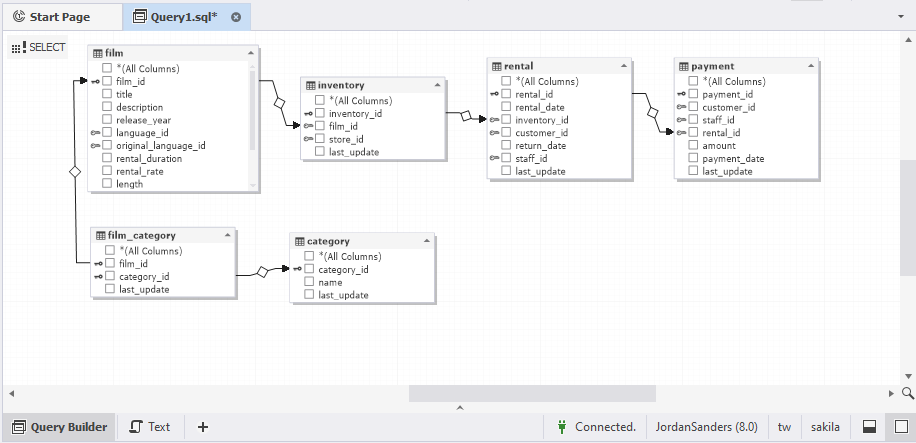
For this, open a Query Builder designer and drag the required tables from Database Objects.
To retrieve required data from the tables, you need to select columns in Query Builder and then execute the query:
- title from the Film table
- name from the Category table
- amount and payment_date from the Payment table
To analyze which film category had more rentals and brought the highest revenue in each particular month, you should sum up and then compare rental amounts of each film category. This way is time-consuming and often followed by errors.
Instead, we recommend using a pivot table.
To create a pivot table, open a Pivot Table document view and drag the required fields from the Data Source pane to the columns of a pivot table. Note that the Data Source pane opens automatically in the upper-right corner displaying a list of fields specified in the query.
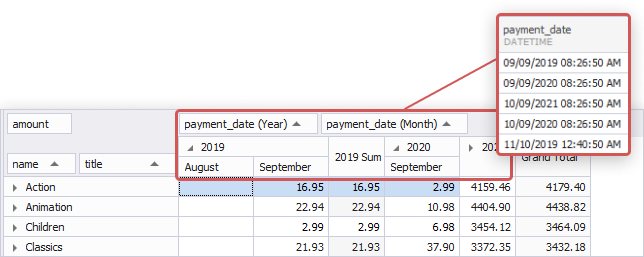
Now, drag the amount field into the Data area, the category name and film into the Row area, and payment date (year and month) into the Column area.
Note
PivotGrid automatically decomposes any fields of the date or time type, so you can see the payment date field decomposed into year, month, and day fields.
The sum of all values and grand total values are automatically calculated for each row and column in the pivot table.
As a result, you have the following summaries:
- Sums of rentals for each film category by month and by year
- Sums of rentals for each film title by month and by year
- Grand Total values for each film category and each film title by month and by year
You can collapse the Category nodes and easily compare the sums of rentals, that’s all.