Creating a Pivot Table
The topic describes how to create a pivot table and analyze data using pivot tables.
Pivot Table
A pivot table is used to easily transform table data from rows to columns, thus, moving values to the resulting fields of the table. You can visually create a pivot table to group, summarize, or aggregate data to present the way you need.
To start creating pivot tables, use a Pivot Table document view.
Tips to create a pivot table:
- You should connect a pivot table to the data you want to display and rearrange in the pivot table. The data source can be a query in the SQL or query document.
- Not all the data source tables are good for converting into a pivot table. The data source should contain a column with duplicated values, which can be grouped, and a column with numeric data, which can be used to calculate grand totals and custom totals.
- You should place data source fields from the Data Source view into pivot table areas to add the data to the pivot table.
Creating a Pivot Table
Let’s create a pivot table using a query file retrieving columns from the Sakila database to analyze which film category had more rentals and brought the highest revenue in each particular month.
To create a pivot table
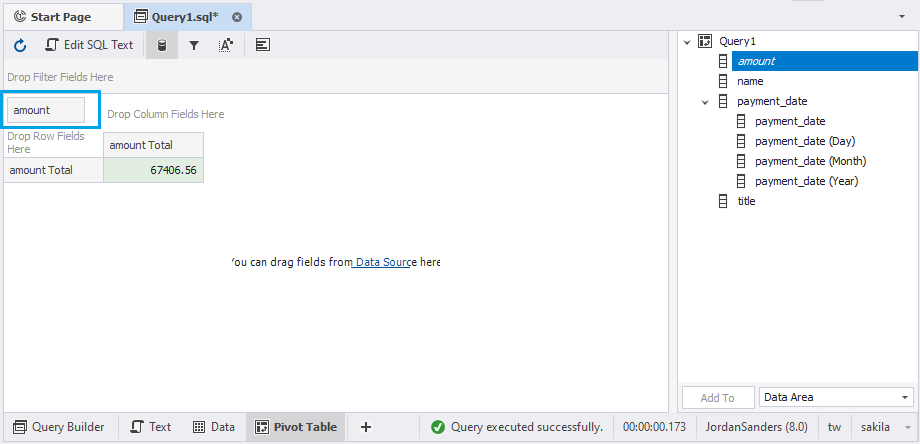
1. Open a query document: On the Standard toolbar, click ![]() New Query to select it as a data source for a pivot table.
New Query to select it as a data source for a pivot table.
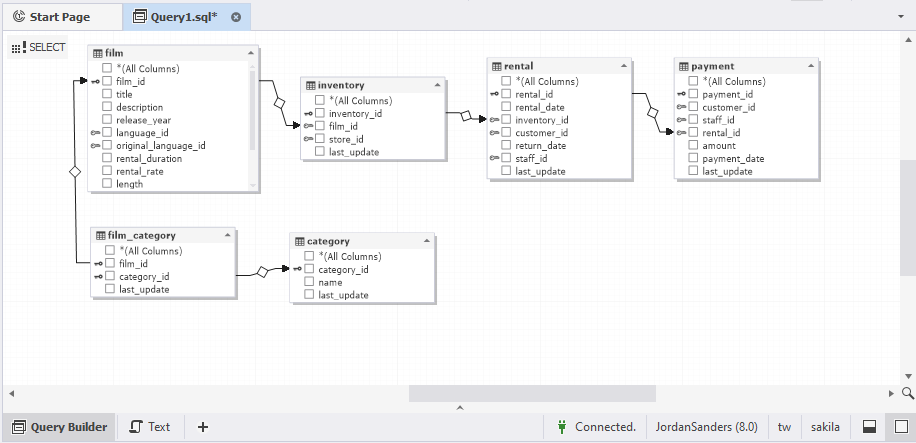
2. From the Database Explorer, drag the tables you want to pivot to the SQL query document. For our example, the tables are as follows: film_category, film, category, inventory, rental, and payment.
3. In the SQL query document, select the following columns - category name, film title, payment amount, and payment date.
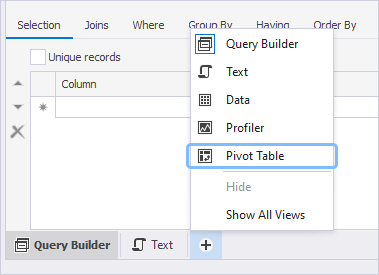
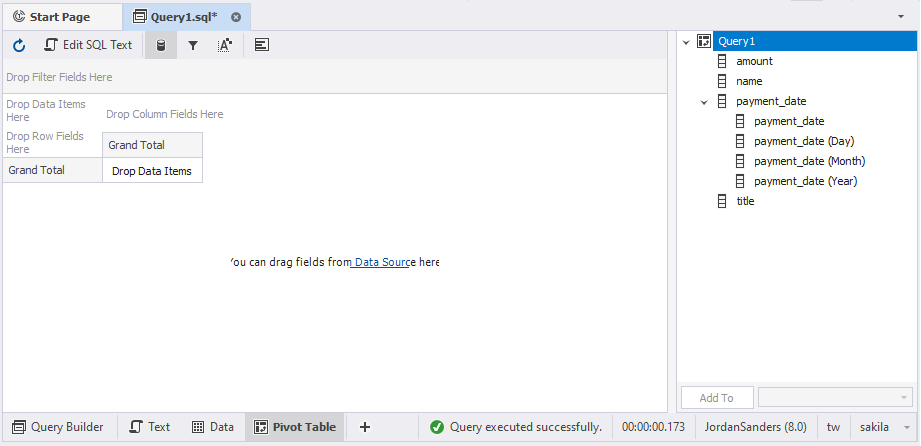
4. At the bottom of the query document, click ![]() Open document view and select Pivot Table to open a pivot table template. The Data Source view opens automatically displaying the fields (when dealing with pivot tables, data source columns are referred to as fields) specified in the query document.
Open document view and select Pivot Table to open a pivot table template. The Data Source view opens automatically displaying the fields (when dealing with pivot tables, data source columns are referred to as fields) specified in the query document.
Note
Any field with date or time data format is decomposed in the Data Source view to its components. In this case the payment date field has been decomposed to four fields: year, month, day, and master field. The latter allows you to add the three payment date sub-fields to a pivot table at once.
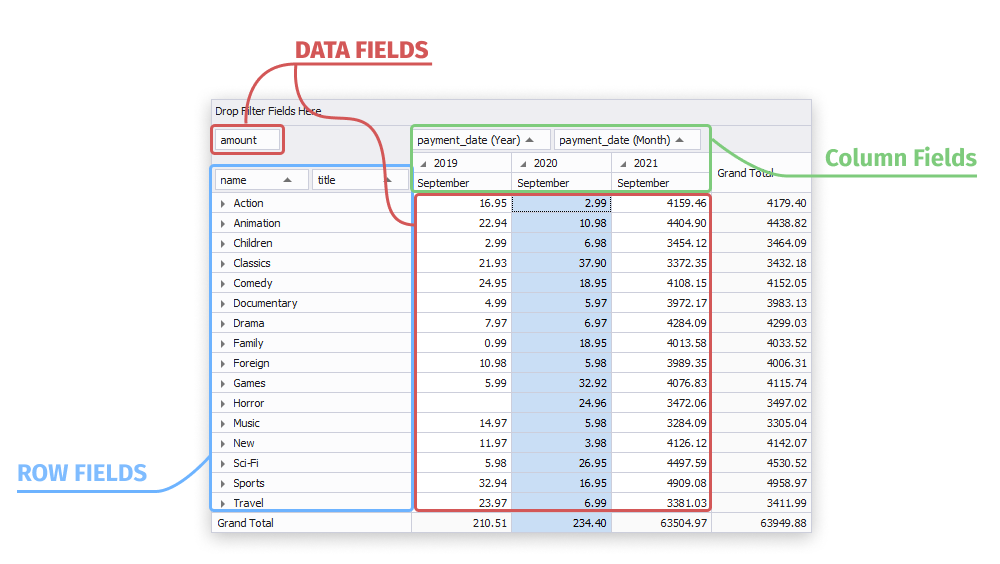
4. Let’s think how to place the selected fields in the pivot table:
- The Category name and film title fields contain string values, some of them are rather long. It will be good to place these fields as row fields to see their values vertically at the left of the pivot table. In this case, you will have the long but tighter table.
- The Payment amount field has numeric data, so it is reasonable to place it into data area where grand totals and custom totals can be calculated.
- If the Payment date field is displayed as a column field, i.e., horizontally in the pivot table, you will be able to group payment amount figures by payment day, month, and year.
Taking into account this information, we’ll add only Month and Year of the payment date to simplify the analysis. Note that you can change the layout and display category name and film title fields as a column field and payment date as a row field. No limitations, the data can be easily rearranged until it becomes the most readable.
To add fields to the pivot table, drag them from the Data Source view to the required pivot table area. Alternatively, select the field in the Data Source view, select a required area from the Destination area drop-down list and click Add To or press ENTER.
To add two or more fields to the same pivot table area, add the first field and then drop the second one before or after the first one in the area.
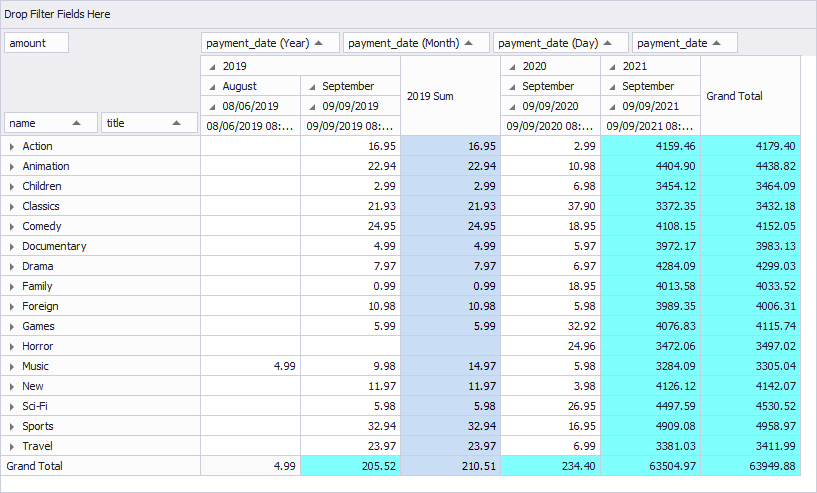
Now, the pivot table contains the following:
- category name and film title as row fields
- payment date (Year) and (Month) as column fields
- payment amount as data field
- custom totals and grand totals that are automatically calculated for the added fields
Managing data in pivot table
After the pivot table was created, you can manage data in the pivot table as follows:
- To hide the film titles, collapse the category name nodes to define the most profitable category by month or year. The names of employees may be hidden by collapsing the department name
- To sort the values in the fields, click Sort
- To filter payment amounts, for example, to display only payment amounts in 57. To do this, click Filter in the payment date (Year) field and clear 2006 in the pop-up window that opens.
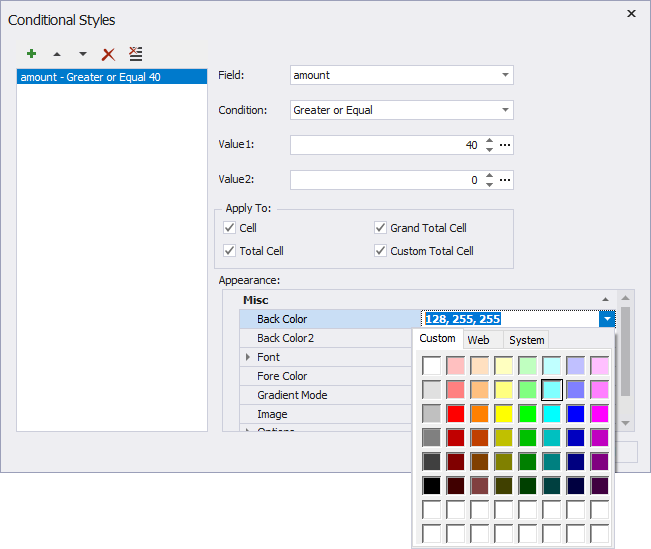
- To apply conditional styles to the pivot table to better process the data. For example, you may need to quickly see what films brought monthly revenue higher than $40.
To do this, click ![]() Conditional Styles on the Pivot Table toolbar or right-click the pivot table header and select Conditional Styles on the shorcut menu. In the Conditional Styles dialog that opens, click Add Condition, specify the parameters, and click OK to add a new condition.
Conditional Styles on the Pivot Table toolbar or right-click the pivot table header and select Conditional Styles on the shorcut menu. In the Conditional Styles dialog that opens, click Add Condition, specify the parameters, and click OK to add a new condition.
To apply a conditional style:
1. In the Field box, select the payment amount field from the drop-down list, Greater or Equal in the Condition field, and enter 0 in the Value1 field.
2. In the Apply To section, clear all the checkboxes except for the Cell checkbox.
3. In the Appearance section, click the BackColor field and select the LightCyan color to highlight the cells.
See the result in the pivot table.