Report Bands
Every report created in dbForge Studio for PostgreSQL is a banded report. This means that every report consists of a number of bands, each one of which has a different type. Every band may contain report controls.
This topic describes the band types available in dbForge Studio, what they can be used for, and how to add, edit, and delete bands in a particular report. To learn more about basic principles of report creation, see the Report Building Basics topic.
What is Report Band?
Report band represents a specific area on a report page used to define the way report controls that belong to it should be rendered. Every band has a set of specific properties that define its behavior.
In the report designer report bands are represented by the parts of the design surface divided with band strips.
Band Types
When you create a new report, it is divided into three basic bands, as shown in the image below. PageHeader, Detail, and PageFooter bands provide space for placing different report controls on them:
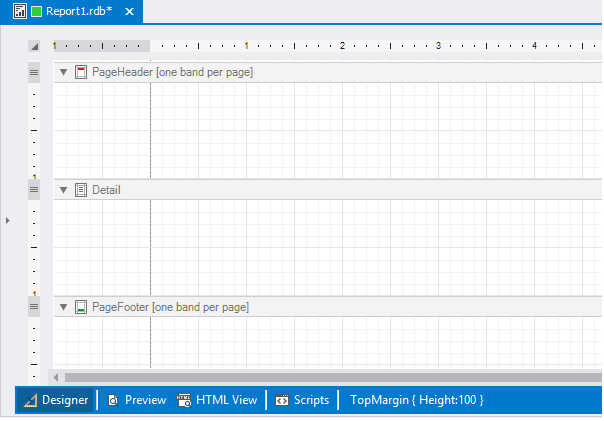
Each band type defines how the controls located on this band will be rendered, their rendering order, and how many times they will be rendered (in case of data-bound report). Note that in the report designer, on some bands may be provided tips with information on bands rendering. For example, on the PageHeader and PageFooter bands the “[one band per page]” tip is displayed.
In the process of creating and working on any report you can add or remove these or any other bands. The band types available in dbForge Studio are listed in the table below.
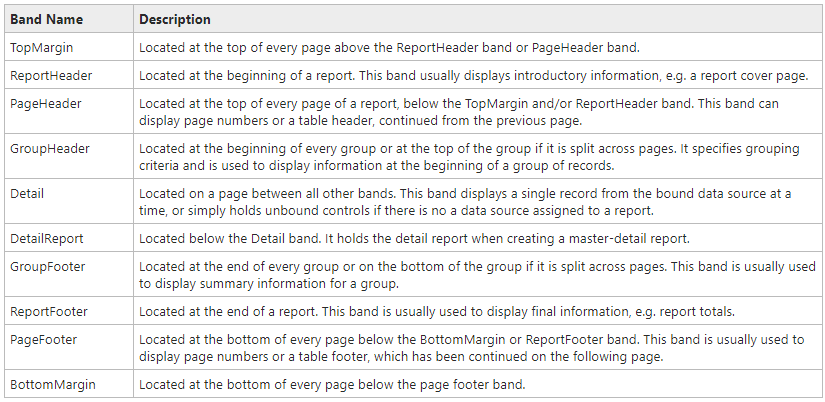
The following image illustrates the relative positions of different band types, and how many times they are rendered in a report.
The Page Header, Page Footer, Top Margin, and Bottom Margin bands are rendered in the report preview on every page.
The Report Header and Report Footer bands are rendered in the report preview only once.
The Group Header and Group Footer bands are rendered for every group of records in a report.
The number of times the Detail band is rendered in a report depends on the number of records returned from the bound data source - one band per record.
Editing Bands
A collection of bands of every particular report can be accessed by the report’s Bands property. The collection of bands and its items can be modified in different ways:
-
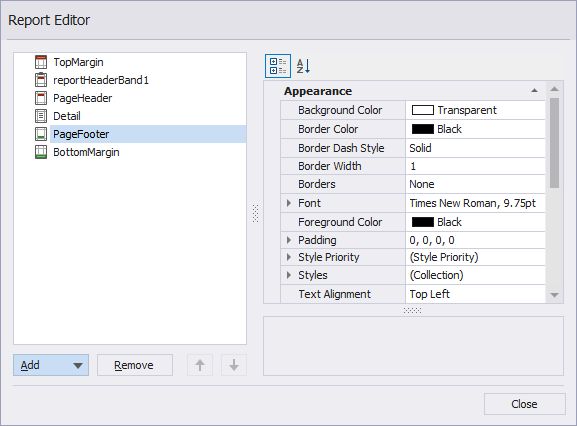
In the Properties window, select a report, and click the ellipsis button for the Bands property. This will invoke the Report Editor dialog box, in which a hierarchical tree of report bands is be displayed. In this window, you can add or remove bands, and also edit their properties.
The Report Editor dialog window is shown on the image below:
-
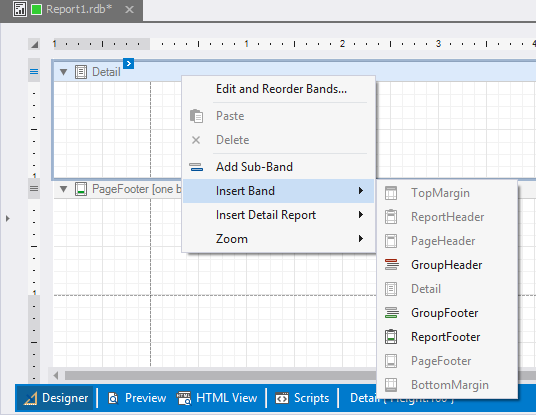
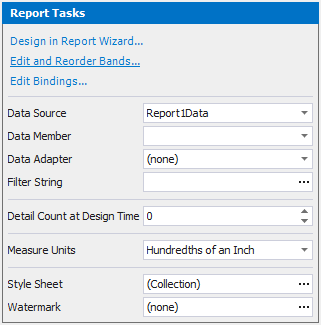
Another way to invoke the Report Editor dialog box is to choose the Edit and Reorder Bands… option in a report’s smart tag, as shown on the image below. Note that this smart tag is shown in the top left corner of the report designer.
-
If you want to add a new band of a particular type, you may use the report shortcut menu. Right-click a report area at design time, as shown in the image below, and select the Insert Band option in the shortcut menu: