Getting Query Profiling Results
This topic explains how to obtain query profiling results using Query Profiler.
1. Open a query file and click the  Query Profiling Mode button on the SQL toolbar to activate the Query Profiler tool.
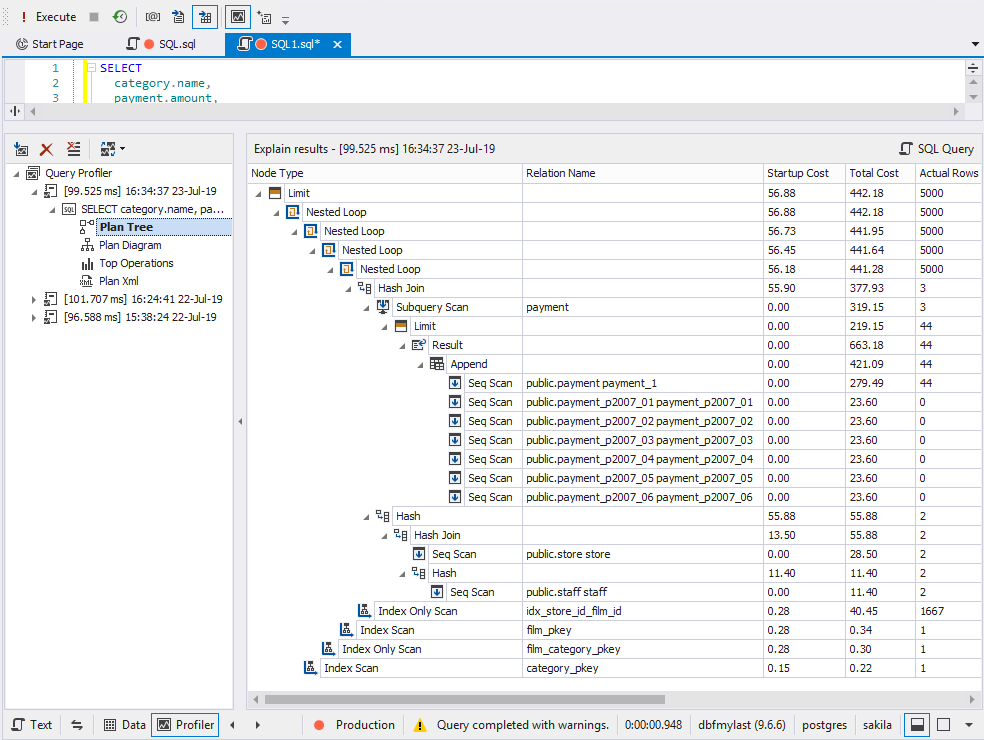
2. Execute the query by clicking the  Execute button or F5. The Profiler document view opens. The query profiling results feature the following stats:
- Plan Tree of query execution.
- Diagram of query execution with the cost of all operations as a percentage of the total batch cost.
- List of top operations taking place on the server.
- Execution plan in the XML format.
3. After you have made changes in the query, click the  Get New Results button in the Profiler document view. New profiling results appear in the tree view as a new node with time and date of query execution. You can easily distinguish and navigate to them.
Note
When you save the query file after getting the query profiling results, the latter will be automatically stored in the .Design file.