


Comparing Query Profiling Results
Last modified: January 30, 2023
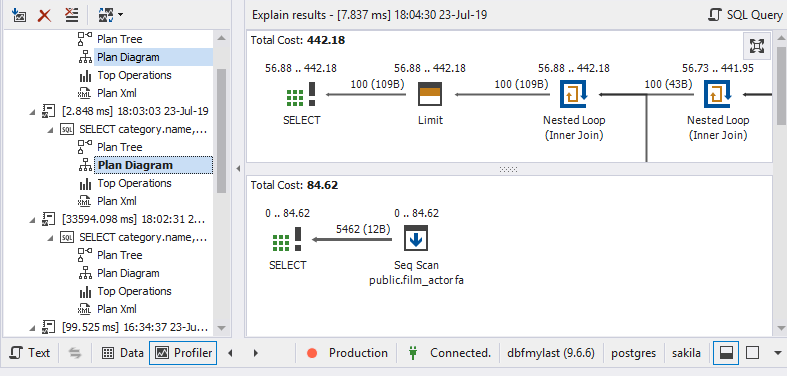
Each time you get profiling results for the executed query, they appear in the tree view as a new node with time and date of query execution. When editing your query, you want to know whether your changes reduce query execution time or not. Query Profiler can quickly compare the profiling results. To compare the results, hold the CTRL key and select both plan diagrams.
Was this page helpful?'%3e%3cpath%20id='thumb_up_2'%20d='M15%2017H5.5V7L11.5%201L12.1667%201.45833C12.4028%201.625%2012.5833%201.83681%2012.7083%202.09375C12.8333%202.35069%2012.8681%202.61806%2012.8125%202.89583L12.7917%203L12%207H17.5C17.9167%207%2018.2708%207.14583%2018.5625%207.4375C18.8542%207.72917%2019%208.08333%2019%208.5V9.6875C19%209.79861%2018.9896%209.89931%2018.9688%209.98958C18.9479%2010.0799%2018.9167%2010.1736%2018.875%2010.2708L16.3944%2016.0875C16.2703%2016.3625%2016.0833%2016.5833%2015.8333%2016.75C15.5833%2016.9167%2015.3056%2017%2015%2017ZM7%2015.5H15L17.5%209.6875V8.5H10.1667L11.1875%203.4375L7%207.625V15.5ZM5.5%207V8.5H2.5V15.5H5.5V17H1V7H5.5Z'%20fill='%2327282C'/%3e%3c/g%3e%3c/g%3e%3c/svg%3e) Yes
Yes'%3e%3cpath%20id='thumb_down_2'%20d='M5%203H14.5V13L8.5%2019L7.83333%2018.5417C7.59722%2018.375%207.41667%2018.1632%207.29167%2017.9062C7.16667%2017.6493%207.13194%2017.3819%207.1875%2017.1042L7.20833%2017L8%2013H2.5C2.08333%2013%201.72917%2012.8542%201.4375%2012.5625C1.14583%2012.2708%201%2011.9167%201%2011.5V10.3125C1%2010.2014%201.01042%2010.1007%201.03125%2010.0104C1.05208%209.92014%201.08333%209.82639%201.125%209.72917L3.60417%203.91667C3.71528%203.63889%203.89931%203.41667%204.15625%203.25C4.41319%203.08333%204.69444%203%205%203ZM13%204.5H5L2.5%2010.3125V11.5H9.83333L8.8125%2016.5625L13%2012.375V4.5ZM14.5%2013V11.5H17.5V4.5H14.5V3H19V13H14.5Z'%20fill='%2327282C'/%3e%3c/g%3e%3c/g%3e%3c/svg%3e) No
No
YesNoWant to find out more?
'%3e%3cpath%20id='Vector'%20d='M4%204V24H24V4H4ZM22%2022H6V9H22V22ZM19%2019H9V18H19V19ZM19%2016H9V15H19V16ZM19%2013H9V12H19V13ZM21%202H2V21H0V0H21V2Z'%20fill='%230071CE'/%3e%3c/g%3e%3cdefs%3e%3cclipPath%20id='clip0_676_40052'%3e%3crect%20width='24'%20height='24'%20fill='white'/%3e%3c/clipPath%3e%3c/defs%3e%3c/svg%3e)
Overview
Take a quick tour to learn all about the key benefits delivered by dbForge Studio for PostgreSQL.

All features
Get acquainted with the rich features and capabilities of the tool in less than 5 minutes.

Request a demo
If you consider employing this tool for your business, request a demo to see it in action.

