Control execution while debugging
The debugger provides commands that control how the routine you’re debugging is executed. All of them are available on the Debug menu and on the Debug toolbar. For the keyboard shortcuts, see Debugging shortcut keys.
Start a debug session
Note
Before you can debug a routine, deploy the debug engine into the database you’re going to debug.
To start a debug session:
1. Compile the routine for debugging.
2. In Database Explorer, double-click the routine to open its editor, then switch to the SQL tab.
3. Set the breakpoints you need.
4. Start debugging in one of these ways:
- On the menu bar, select Debug > Start.
- On the Debug toolbar, click
 .
.
Note
If you haven’t compiled the routine for debugging, dbForge Studio prompts you to do this. Click Yes to add debug information to the routine body.
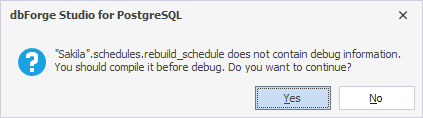
5. If the routine has parameters, the parameters window opens. Enter a value for each parameter and click OK.
dbForge Studio switches to the debug layout, and execution stops at the first breakpoint, or at the first executable statement of the body if you started with Step Into.
A yellow arrow in the left margin of the editor marks the statement that’s about to be executed.
Note
Trigger functions and event trigger functions aren’t started from their editor. You set a breakpoint in the function and then run the statement that fires it. For more information, see Debug a trigger function and Debug an event trigger function.
Step through code
Stepping is a common debugging technique that lets you execute code one statement at a time.
Step Into
Step Into enters the called routine and pauses at its first statement.
Note
Step Into enters a called routine only if that routine has also been compiled for debugging. Otherwise, the debugger executes the call as a whole and pauses at the next statement in the current routine.
Step Over
Step Over executes the next statement without stopping inside any routines it calls. If the statement calls another routine, the debugger executes the call as a whole and pauses at the next statement in the current routine.
Step Out
Step Out resumes execution until the current routine returns, and then breaks at the point the routine was called from. Use it when you’ve seen enough of a routine you stepped into and want to get back to its caller.
Run To Cursor
Run To Cursor resumes execution and breaks at the statement the caret is on. It works like a one-time breakpoint, so you don’t have to set and then delete a real one.
Continue, break, and stop debugging
Continue
Continue resumes execution after a break. The routine runs until the next breakpoint is hit, until a Run To Cursor position is reached, or until it finishes.
Break All
Break All suspends a routine that is currently running and switches the debugger into break mode. Use it when a routine takes longer than you expected, for example, when a loop doesn’t terminate.
Restart
Restart stops the session you’re currently debugging and immediately starts a new one. The parameters window opens again, so you can debug the routine with different input values. Restart the session after you change the code of the routine.
Stop Debugging
Stop Debugging terminates the debug session. Unlike Break All, which keeps the session alive in break mode, Stop Debugging ends it. dbForge Studio leaves the debug layout, and the connection that the debug engine used is released.
Note
Stop Debugging doesn’t always terminate the routine right away. If the routine is in break mode, it stops immediately. Otherwise, dbForge Studio finishes it in the background so you can start a new debugging session without waiting. No more than two routines can be finishing in the background at the same time; if two are already terminating, you must wait for one of them to stop before you can start another debugging session.