Creating a Pivot Table
This topic describes how to create pivot tables and efficiently analyze data using pivot tables.
Pivot Table
Pivot table is a table that allows you to easily rearrange or pivot your data by a simple drag of a mouse until you get the layout best for understanding the data relations and dependencies. You can create pivot tables using Pivot Table view of the SQL document.
Some facts about a pivot table creation:
- You should connect a pivot table to the data you want to display and rearrange in the pivot table. The data source can be a query in the SQL or query document.
- Not all the data source tables are good for converting into a pivot table. The data source should contain a column with duplicated values, which can be grouped, and a column with numeric data, which can be used to calculate grand totals and custom totals.
- You should place data source fields from the Data Source view into pivot table areas to add the data to the pivot table.
Creating Pivot Table
Let’s create a pivot table using a query file retrieving four three columns from the Sakila database.
Note
As the original Sakila database contains a huge number of table records, they were cut down to half to illustrate the example.
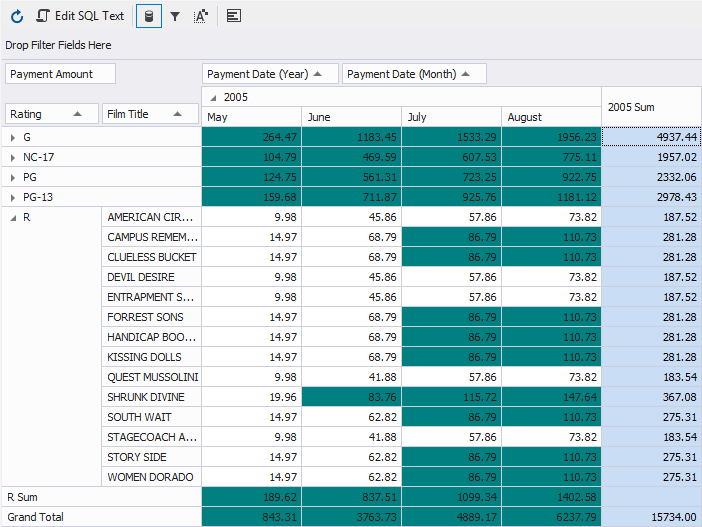
Let’s analyze which film rating had more rentals and brought the highest revenue in each particular month. To do this:
1. Open a new SQL document by clicking the New SQL icon on the Standard toolbar, and write a query to select:
- Name from the Category table
- Amount from the Payment table
- Payment data from the Payment table
- Title from the Film table
- Rating from the Film table
- Rental rate from the Film table
2. Execute the query and navigate to the query output. Right-click anywhere in the data grid, point to Send to and then click Pivot table.
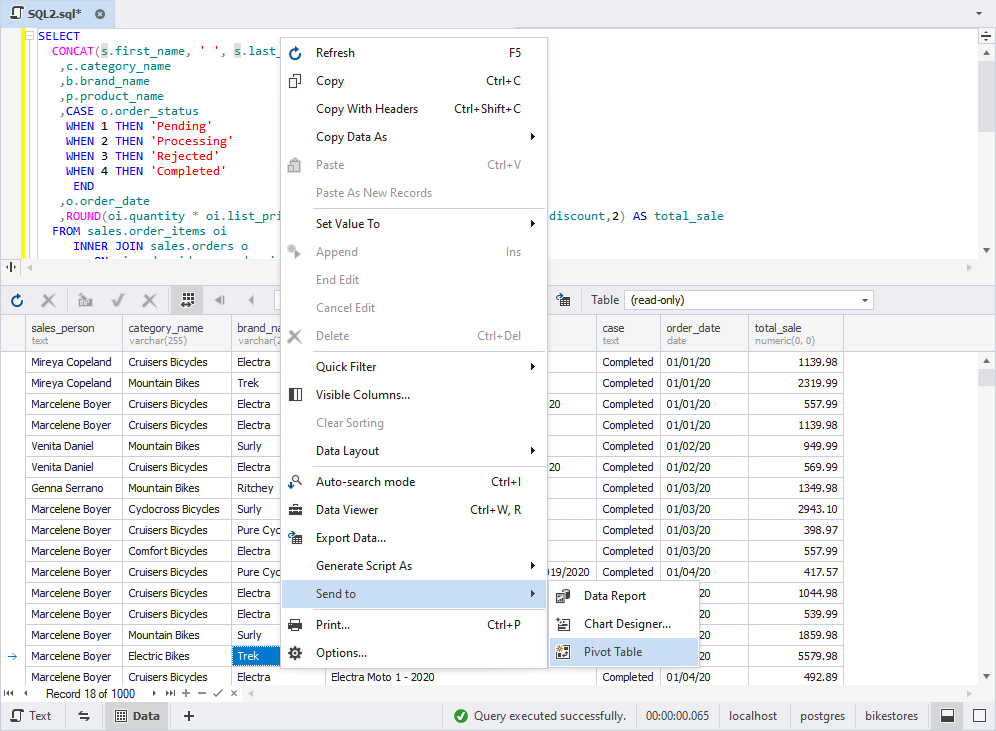
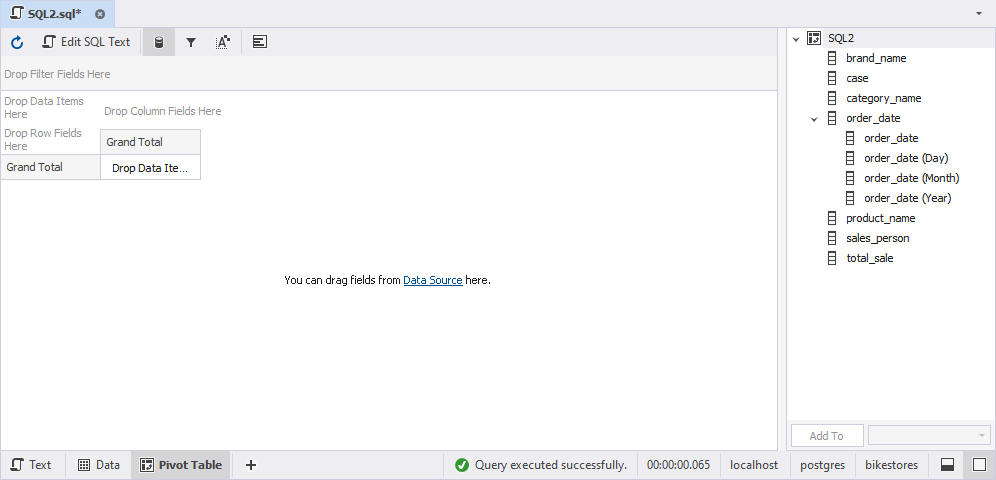
The Data Source view opens automatically with the fields (when dealing with pivot tables, data source columns are referred to as fields) specified in our query document.
Note
Any field with date or time data format is decomposed in the Data Source view to its components.
In this case the payment date field has been decomposed to four fields: year, month, day, and master field. The latter allows you to add the three payment date sub-fields to a pivot table at once.
You can also use dbForge AI Assistant to create a pivot table.
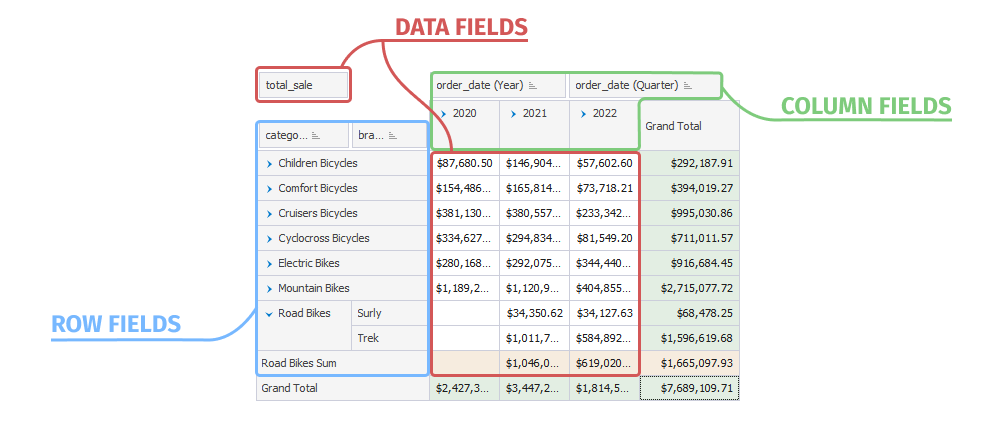
3. Let’s think how to efficiently place the selected fields in the pivot table:
- Rating and film title field contain string values, some of them are rather long. It will be good to place these field as row field to see their values vertically at the left of the pivot table. In this case you will have the long but tighter table.
- Payment amount field has numeric data, so it is reasonable to place it into data area where grand totals and custom totals can be calculated.
- If Payment date field is displayed as column field, i.e., horizontally in the pivot table, you will be able to group payment amount figures by payment day, month, and year. Let’s add only Month and Year of payment date to simplify the analysis.
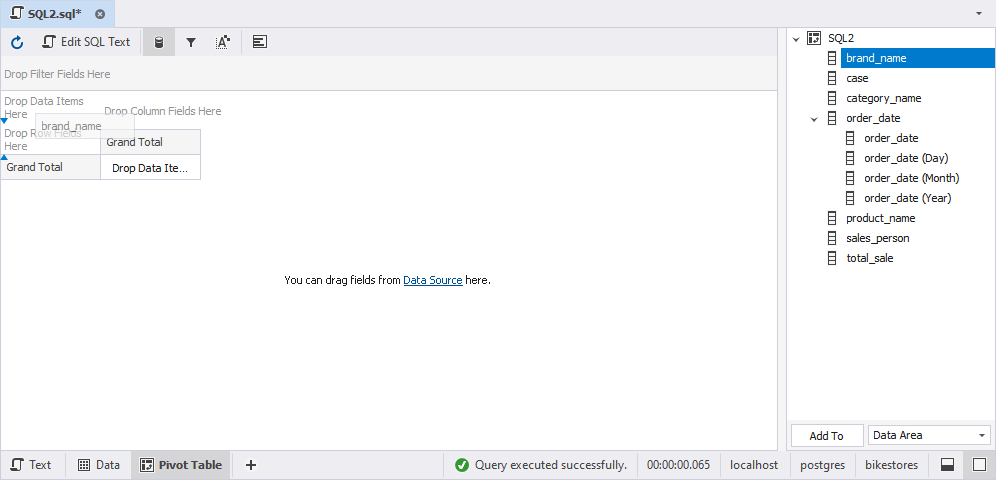
To add fields to the pivot table, drag-and-drop them from the Data Source view to a required pivot table area or highlight a field in the Data Source view, select a required area from the Destination area drop-down list and click the Add To button or just press ENTER.
To add two or more fields to the same pivot table area, add the first field and then drop the second one before or after the first field in the area.
4. Now our pivot table contains the following:
- rating and film title as row fields
- payment date (Year) and (Month) as column fields
- payment amount as data field
- custom totals and grand totals that are automatically calculated for the added fields
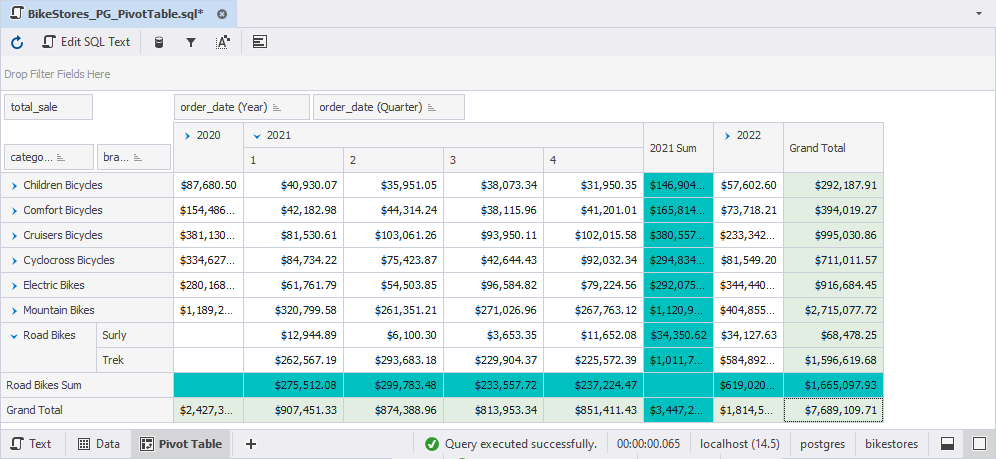
The film titles may be hidden by collapsing the rating name nodes to define the most profitable rating by month or year. To sort the values in the fields, click the Sort button. You can filter payment amounts, for example, to display only payment amounts in 57. Click the button in the payment date (Year) field and clear 2006 in the dialog box. For more information about managing data in the pivot table, refer to Managing a Pivot Table topic.
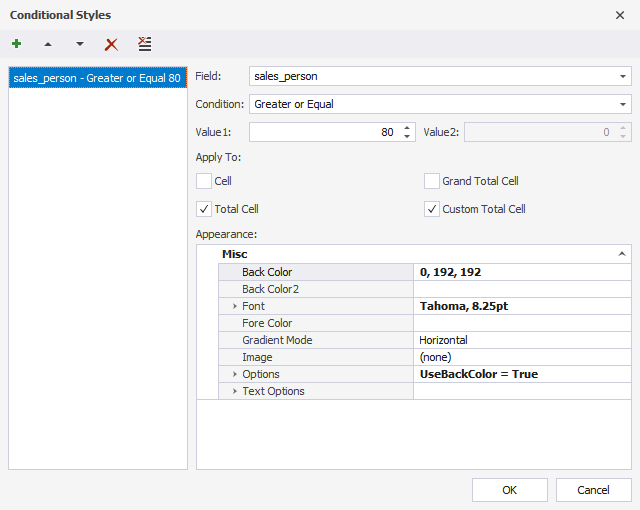
5. If required, you can apply conditional styles to the pivot table to better process the data. For example, you may need to quickly see what films brought monthly revenue higher than $40.
- Click
 on the Pivot Table toolbar or right-click the pivot table header and select Conditional Styles on the menu. In the opened dialog, click the button to add a new condition.
 - Select payment amount in the list of fields, Greater or Equal in the Condition field, enter 0 in the Value1 field. In the Apply to section, clear all the check boxes except the Cell check box. In the Appearance section, click the BackColor field and select the LightCyan color to highlight the cells.
See the result in the pivot table.