Creating a Chart from a Pivot Table
In dbForge Studio, you can view pivot data as a chart. Such an option helps to visualize data dependencies and compare it.
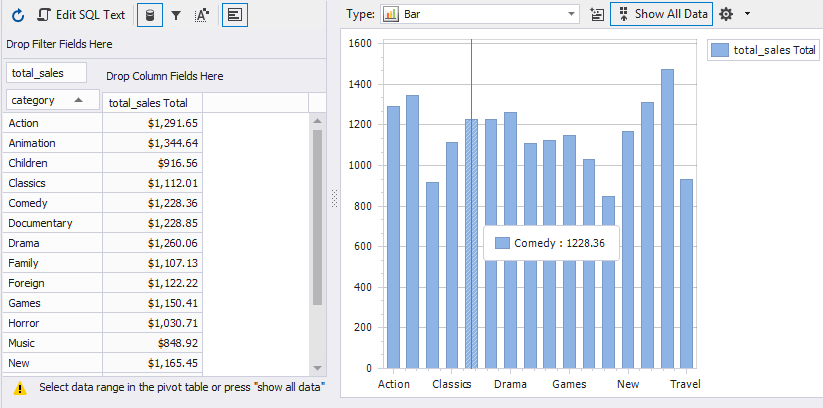
You can view a chart associated with the needed pivot data directly in the pivot table document, in a special view.
Let’s build a chart basing on the data of the pivot table created in the How To: Create a Pivot Table topic.
- Open the Charts view of the pivot table document by clicking the Show Chart button on the pivot table document toolbar.
-
Select the data that should be displayed on the chart on the Pivot Table view of the document by pressing CTRL and clicking the needed cells of the pivot table or by selecting the cells of the table with the left mouse button pressed:
- Adjust the Chart options using the Chart view toolbar, shortcut menu, or Chart Designer.