When you run a query against a database server, it returns a response to the client. There are three types of the server response to a SQL query:
- Tabular data
- Status (info) message
- Error
Tabular data is displayed in Data Editor. Status messages and errors can be displayed in the Output window. Errors are also shown in the Error List window.
The guide describes how to view server messages and errors in the Output window and in the Error list window.
Use the Output window
The information on query execution is displayed in the Output window.
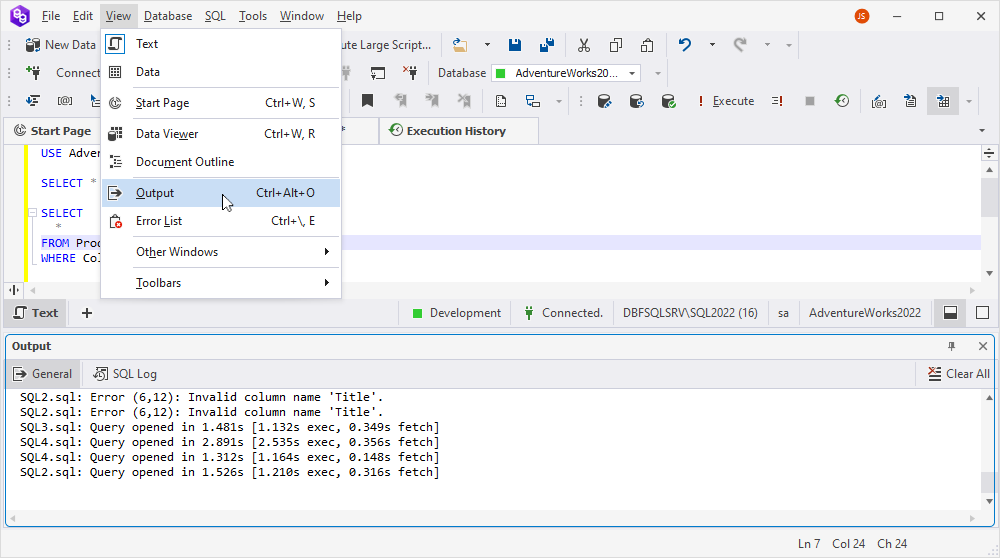
Output panes
The window can contain up to four output panes (depending on the specific product):
-
General: Contains most output messages, not only from a database server but also from the application itself.
-
Data: Displays query results represented as a formatted text. This pane remains empty unless the Redirect Data to Output Window option is set.
-
SQL Log: Displays all the SQL queries executed by an application during the current session. To see the queries, select Write queries sent by the program to the SQL Log section. This option can be managed at: Tools > Options > Environment > Output.
Server errors are also logged to the Output window.
Search for output messages
You can search text in the Output window. To find specific text:
1. Click the Output window.
2. Open the Find and Replace window by pressing CTRL+F.
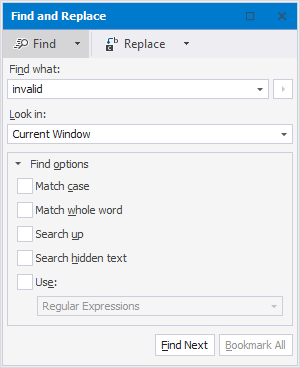
3. Enter search text and press ENTER or click Find Next.
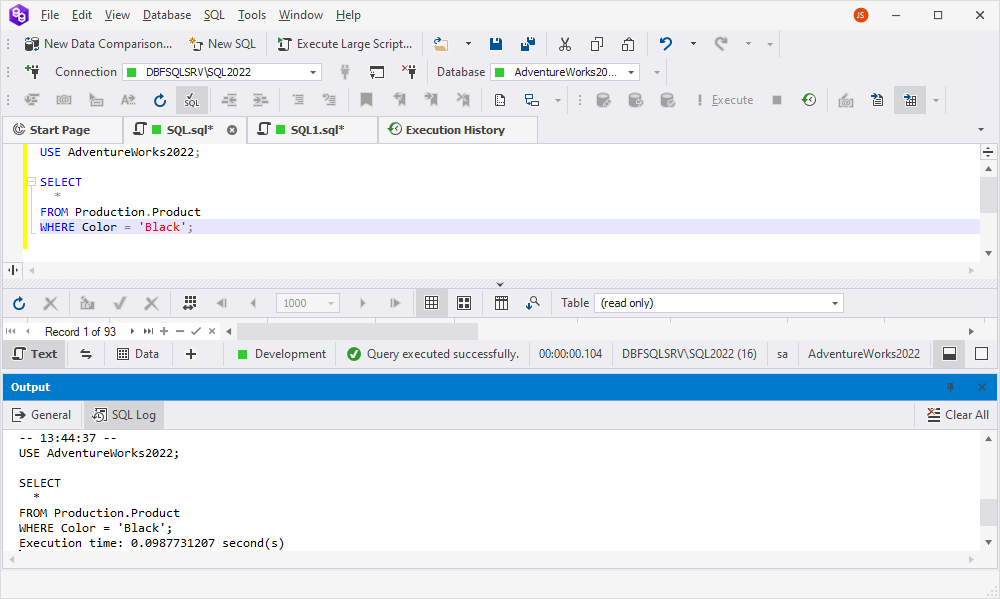
SQL Log
The SQL Log window displays the queries executed along with the time taken to complete the execution. By default, the feature is not available.
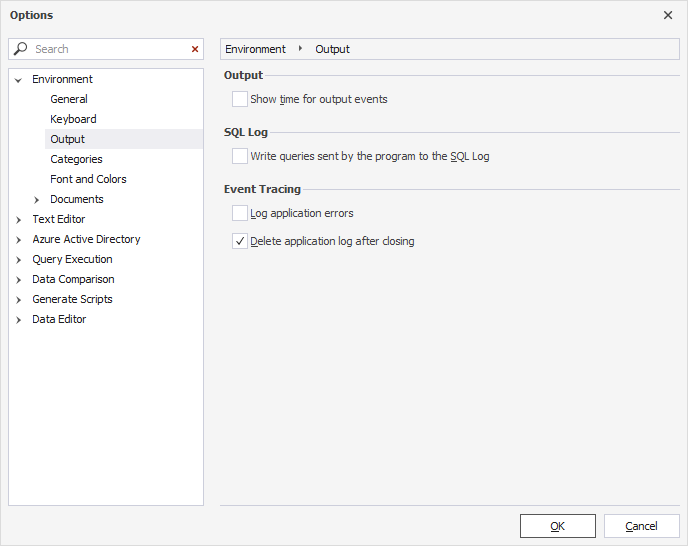
To configure the SQL Log window:
1. Right-click the SQL document and select Settings > Options.
2. In the Options window that opens, navigate to Environment > Output.
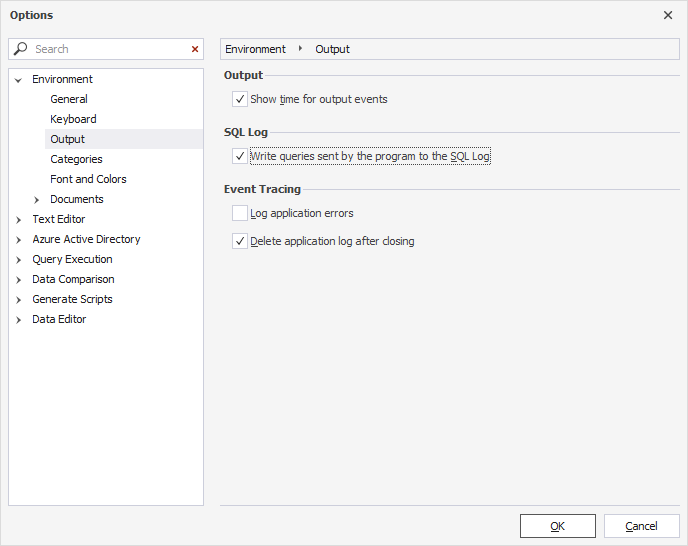
3. Select Show time for output events to enable the timestamps for the executed queries.
4. Select Write queries sent by the program to the SQL Log to display the text of the executed query in the SQL Log window.
Note
By selecting Log application errors and/or Delete applications logs after closing, you can configure the event tracing.
The SQL Log window displays the following result:
Use the Error list window
When something goes wrong with the query execution, an error message is displayed. Whether it’s a user error, such as a mistyped query, or database server error, this information will be shown in the Error List window. To open the Error List window, go to the View menu and select Error List.
Here is an example of an error displayed in the Error List window.
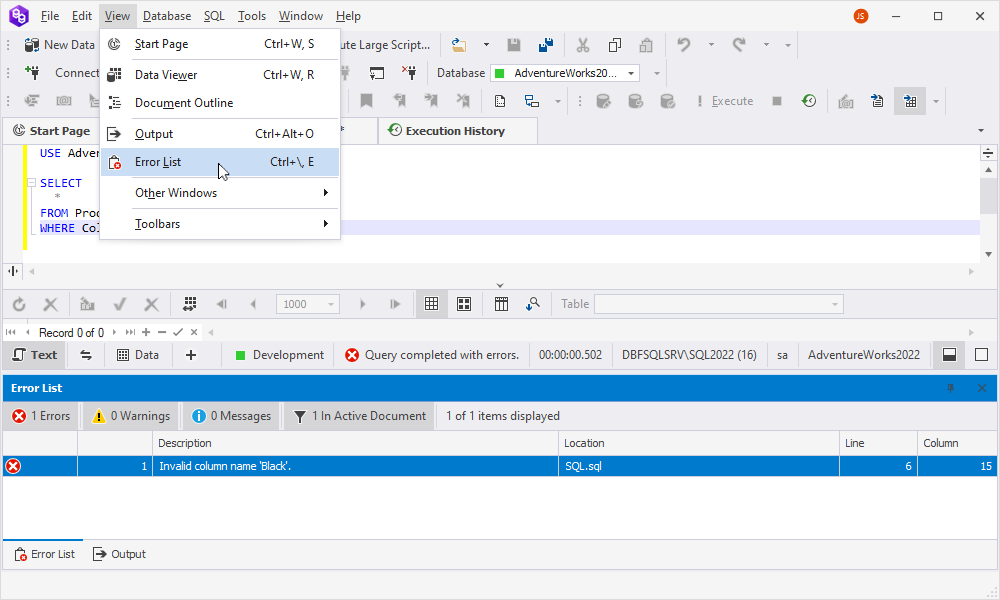
Error List shows not only errors but also warnings and informational messages that require user attention. A warning is a non-blocking error, while an informational message is just a user notification.
You can filter messages by type using appropriate controls on the toolbar of the Error List window.
You can navigate to the error position by double-clicking it in the list or selecting Go to Error on the pop-up menu.
How to view errors from the current document only
Error List aggregates all error messages in the application. And if you have multiple open documents with errors, the error processing can quickly become awkward.
For convenience, the window has another filter control: In Active Document. It allows you to view only those errors that are located in the current document window.