Work with transaction logs
This topic explains how to manipulate the data results in the dbForge Transaction Log document.
View transaction properties
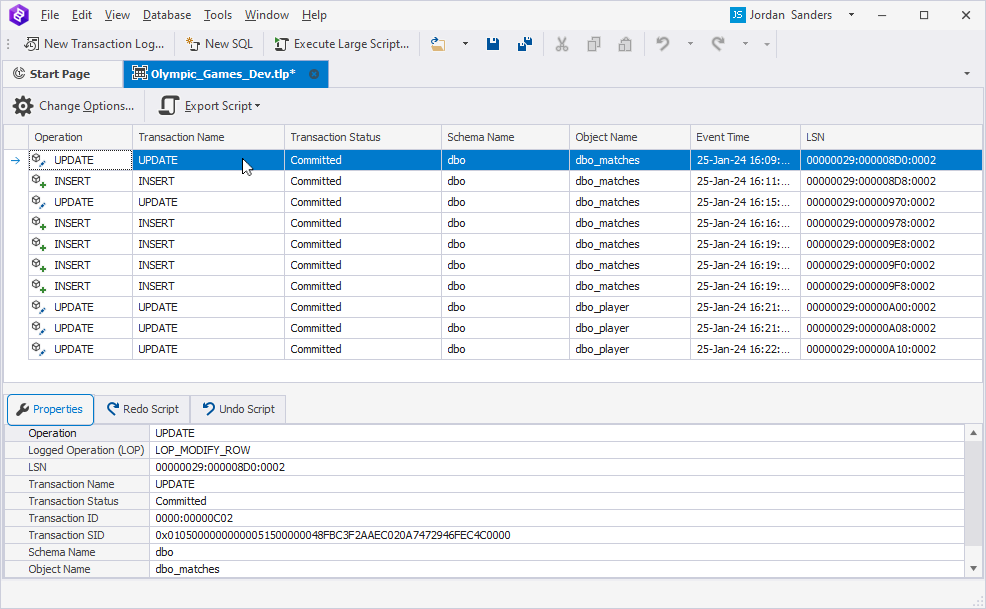
You can view the details of the selected transaction in the Properties tab in the lower part of the data results grid.
Adjust transaction filtering options
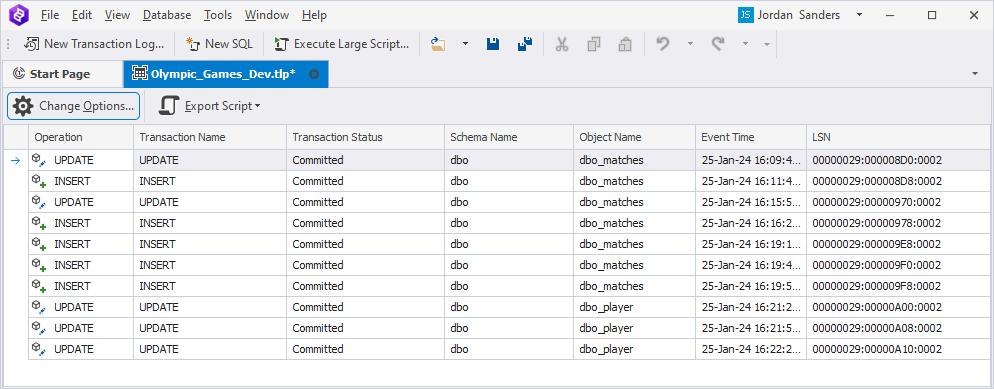
To change the DML operations you want to display in the data results grid, click Change Options on the ribbon.
This will open the Transaction Log Wizard, where you can specify date and time and select the DML operations you want to display.
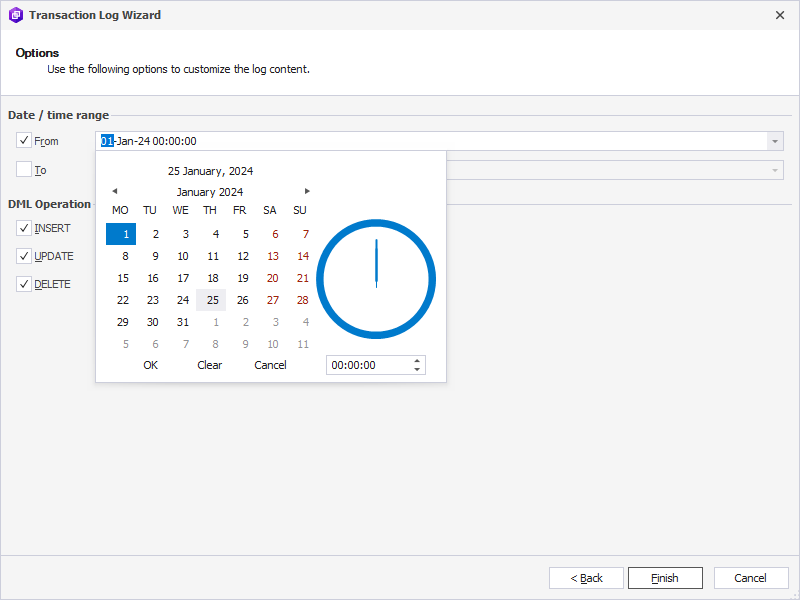
To apply the changes, click Finish. The data grid will be updated according to the new filters you used.
Manage output results
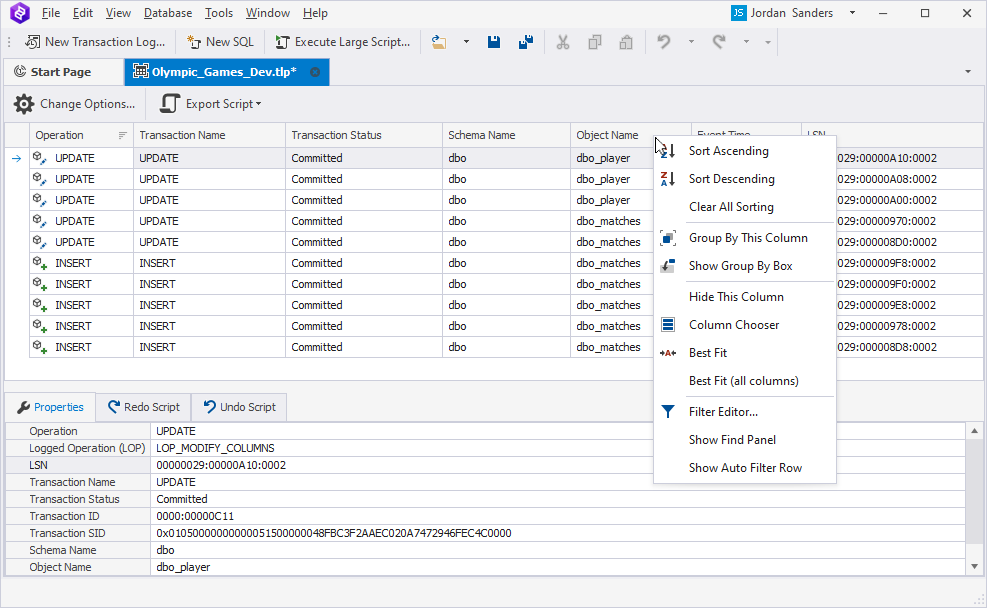
You can use data management options from the shortcut menu to sort columns in ascending or descending order, change the column order and width, group them by order, or hide data by the specified column.
Right-click the column header and select the required option:
-
Sort Ascending or Sort Descending to sort the column in an ascending or descending order, respectively.
-
Clear All Sorting to cancel all sorting on the columns.
-
Group By This Column to group data by the column and automatically display it as collapsable groups.
-
Show/Hide Group By Box to display or hide the group data by the column.
-
Hide this Column to hide the column from the data results grid.
-
Column Chooser to hide or show a column in the data results grid.
-
Best Fit to adjust the column width to the column content.
-
Best Fit (all columns) to adjust the widths of all columns simultaneously. Note that this operation can take some time if there are many records in the grid.
-
Filter Editor to open the Filter Editor window to set filter criteria.
-
Show Find Panel to open the panel to search the text in the data results grid.
-
Show Auto Filter Row to filter data on the fly by typing the text in the Auto Filter row.
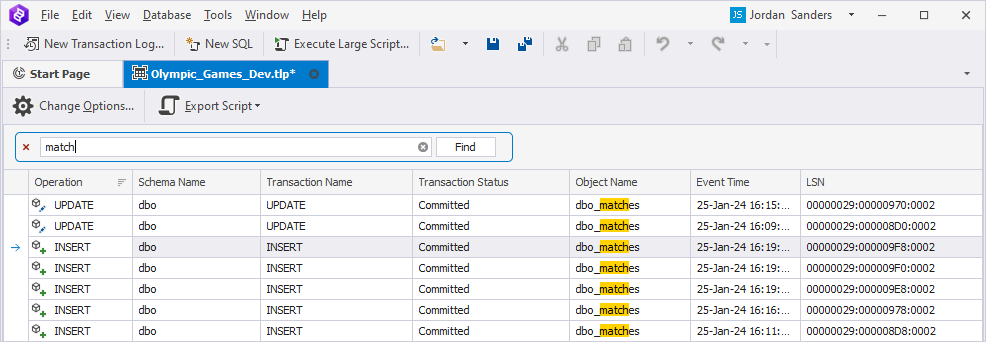
Find the text in the data results grid
Selecting the Show Find Panel option will open the find panel, where you can enter the text. The default search mode is case-insensitive, which means that the search function does not differentiate between uppercase and lowercase letters. So, as you type, the search results will include matches highlighted in the grid regardless of whether the text in the search query is in uppercase or lowercase.
Filter data with Auto Filter Row
1. Right-click the column header and select Show Auto Filter Row to display the row that allows you to filter the data on the fly by typing the text in that row. The data will be automatically filtered based on the text specified in that row.
2. The automatic filtering row will be displayed on top of the columns in the grid.
3. On the left, select the comparison operator.
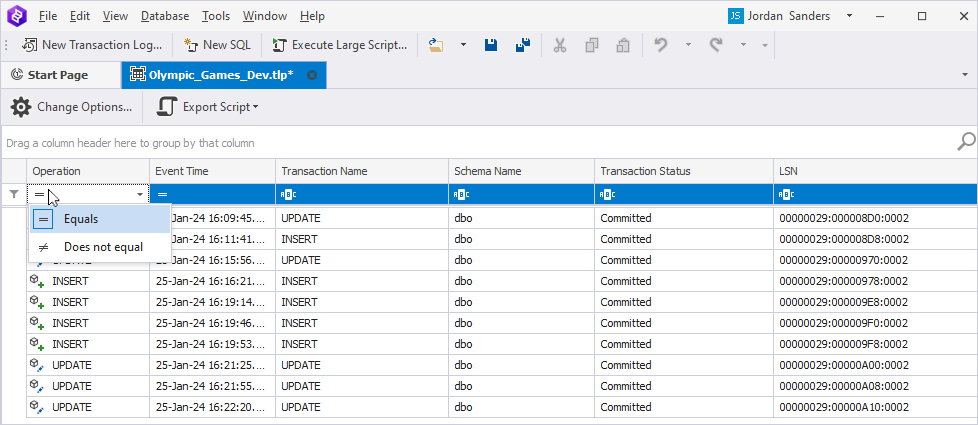
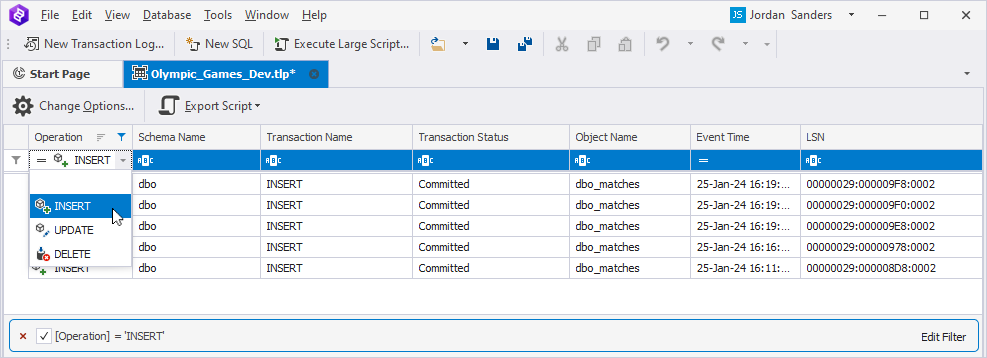
4. To apply a filter to the required column, enter the value by which you want to filter the data.
The filtering condition will be automatically displayed at the bottom of the data results grid. To remove the condition, click the cross icon or clear the checkbox at the bottom of the grid. To edit the condition, click Edit Filter in the lower right corner of the grid.
The Filter Editor dialog opens, where you can modify the conditions.
To remove the auto filter row, right-click the header and select Hide Auto Filter Row.
Filter data in the grid
To filter data by column, click Filter on the column header. In the pop-up window that appears, select the required checkbox based on which the data in the current column will be filtered.
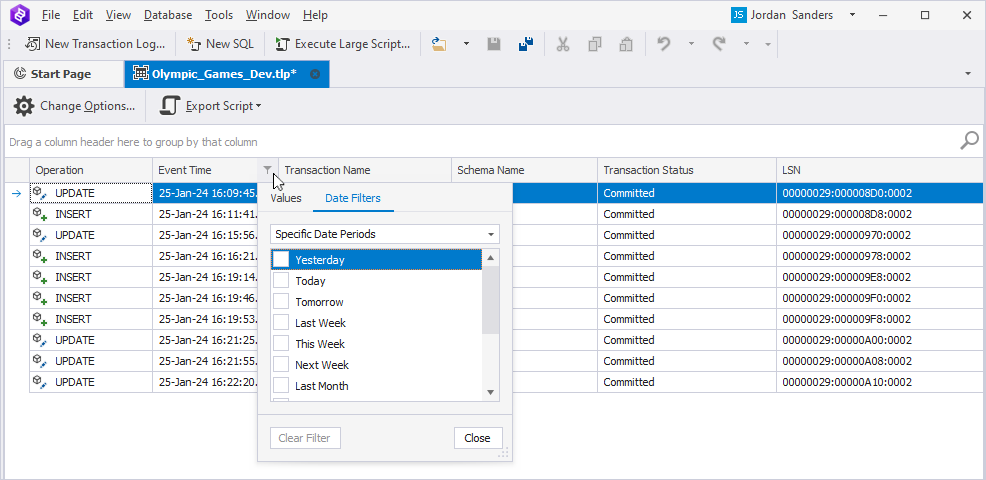
When the data is filtered, the column filter icon is changed to active filter to indicate the applied filter. The filter condition appears at the bottom of the grid, providing you a one-click quick access to the filter condition parameters, which can be managed in the following ways:
- To remove all filter conditions, click the cross sign. Alternatively, right-click the column header and select Clear Filter to remove the current filter.
- To switch from the filtered data to the full data display, clear the checkbox next to the condition.
- To edit the filter condition, click Edit Filter. The Filter Editor dialog opens.
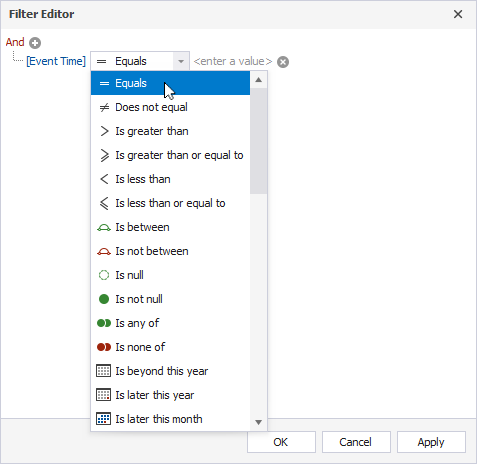
To create or modify the filter condition, right-click the column header and select Filter Editor. The dialog opens with the preselected column whose header you clicked and the default operator And. If you want to change the column, click it and select another column from the dropdown list.
Note
Clicking And will open the menu, where you can choose the other operator, add another condition or group of conditions, or remove filters by selecting the corresponding option.
In the Filter Editor dialog, choose a relation type and enter a value to set up a filter condition. To save the changes, click OK. To remove the condition, click ![]() Delete next to the corresponding condition.
Delete next to the corresponding condition.
Sort data in the grid
To sort data directly in the data results grid, right-click the required column header and select Sort Ascending or Sort Descending. Alternatively, use the sort glyph, a small arrow displayed at the column header’s right edge, on the column header.
To assign a secondary sorting, right-click another column header and select Sort Ascending or Sort Descending. You can set as many sorting columns as you need. To stop sorting on a specific column, click it while holding the CTRL key.
To clear column sorting, right-click the column header and select Clear Sorting.
The sort glyph indicates the current sort order of a column. If data is sorted in ascending order, the sort glyph represents an up arrow. When sorting in descending order, the sort glyph is displayed as a down arrow. If the column isn’t sorted, the sort glyph is hidden.
Group data in the grid
To group data by column, right-click the column header and select Group By This Column. The data is automatically displayed in groups with collapsed nodes.
To open the Group by Box panel, right-click the column header and select Show Group by Box. Here you can drag a column header to group by that column. You can group the data by multiple columns. This panel will also display the already grouped data.
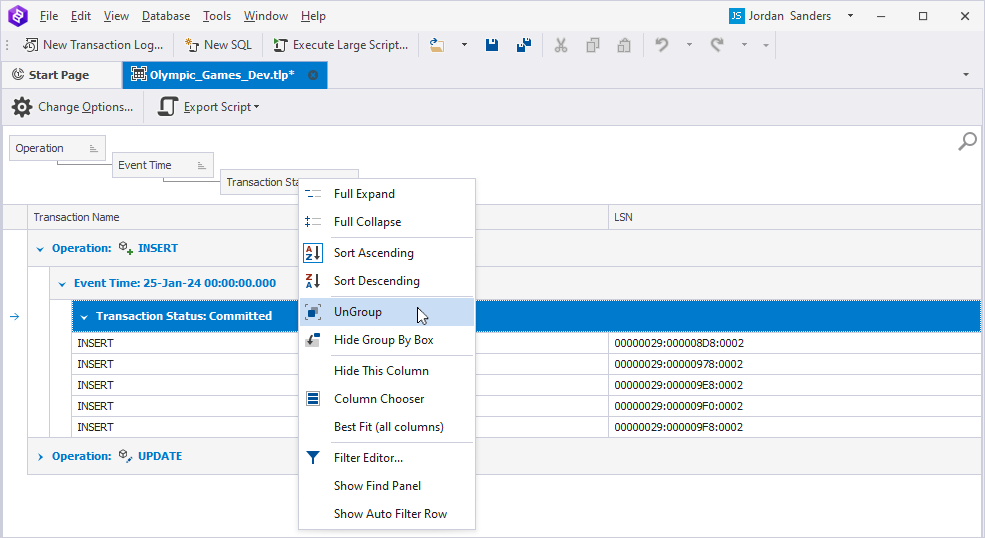
To expand or collapse all groups, right-click the Group By Box panel and select Full Expand or Full Collapse.
To cancel grouping by column, drag the column header from the Group By Box panel to the grid or right-click the column header and select Ungroup. To hide the the Group By Box panel, right-click it and select Hide Group By Box.