How to work with T-SQL Code Analyzer
Enable T-SQL Code Analyzer
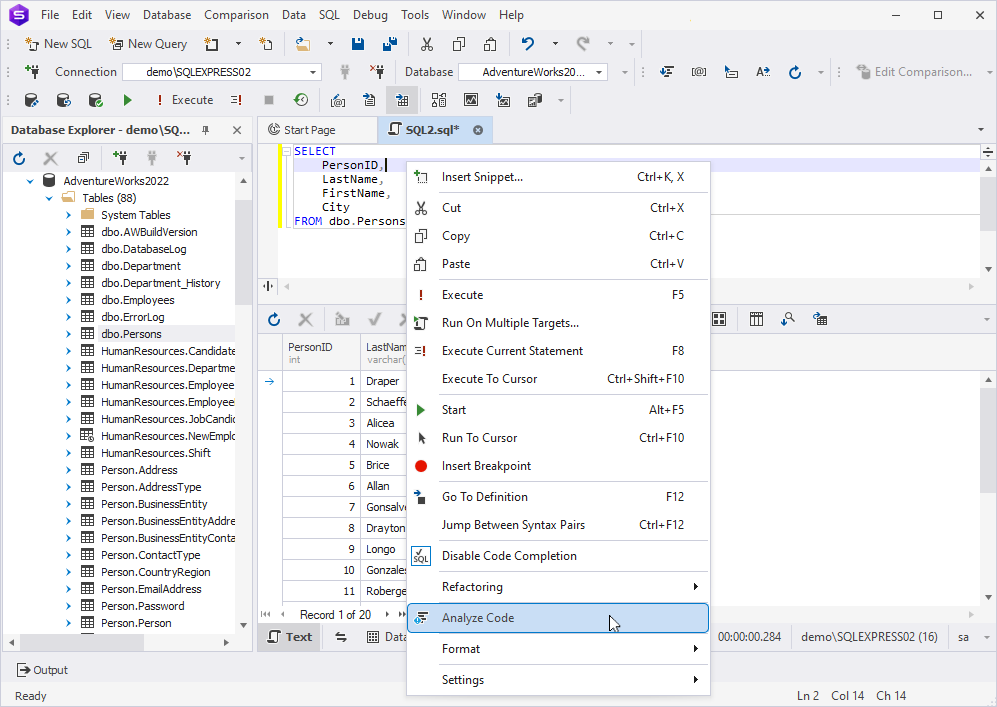
1. In a SQL document, enter the code you want to validate.
2. Right-click the SQL document and select Analyze Code.
Note
T-SQL Code Analyzer validates code only in the active SQL document and only after you select Analyze Code. It does not automatically analyze code as you write.
Inspect issues
To analyze the code in your SQL document against the code analysis rules of your active profile:
1. Right-click the SQL document and select Analyze Code.
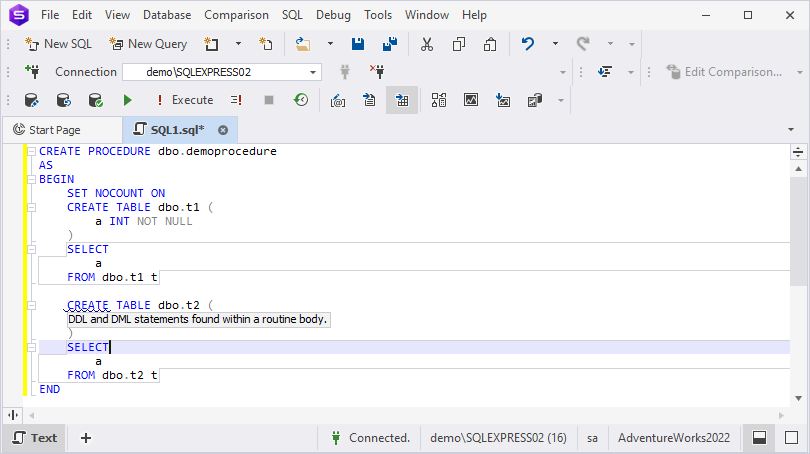
After dbForge Studio finishes the analysis, non-compliant code is underlined with a green wavy line.
Note
You can also use dbForge AI Assistant to explore and apply best practices for writing code.
T-SQL Code Analyzer output
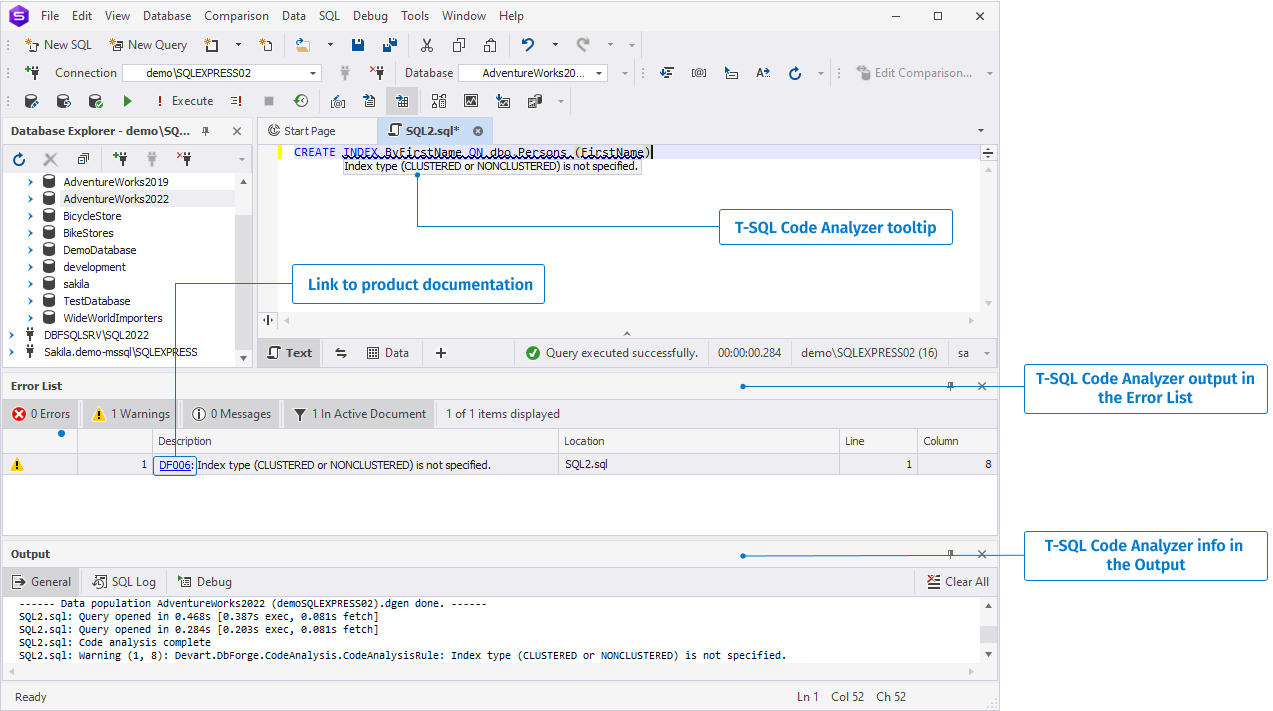
2. Hover over the underlined code fragment to view the issue details.
View T-SQL Code Analyzer output
Additionally, the code analysis results are displayed in the Error List and Output windows.
Code analysis output in the SQL document
When a rule is triggered in a SQL document, the corresponding code is underlined with a wavy line. Hovering over this code displays a hint with the rule details.
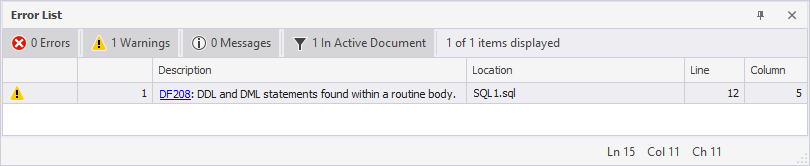
Code analysis output in the Error List
When T-SQL Analyzer identifies code that violates the rules, it displays one of the following message types in the Error List window:
-
 Warning
 -
 Error
Error -
 Hint
Hint
The Error List window presents the T-SQL Code Analyzer output in a table format:
- Code: Displays the rule identifier, clicking which opens a detailed description of the rule in the product documentation. The Description column contains the rule title.
- File: Shows the document name where the analysis is being conducted.
- Line: Shows the line number where the rule was triggered. For additional details about the rule, click the Expand icon at the beginning of the row.
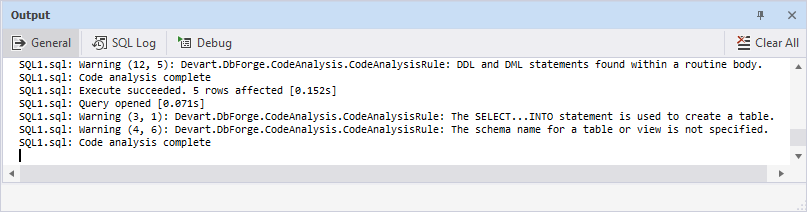
Code analysis output in the Output window
Information regarding the code analysis results is also displayed in the Output window.
Enable and disable code analysis rules
You can customize T-SQL Code Analyzer by disabling rules that you do not find useful to reduce the number of issues in your script.
To view the list of all rules and enable or disable them individually:
1. Select Tools > Options > Code Analysis > Profiles.
2. Select the active profile, then click Open Selected.
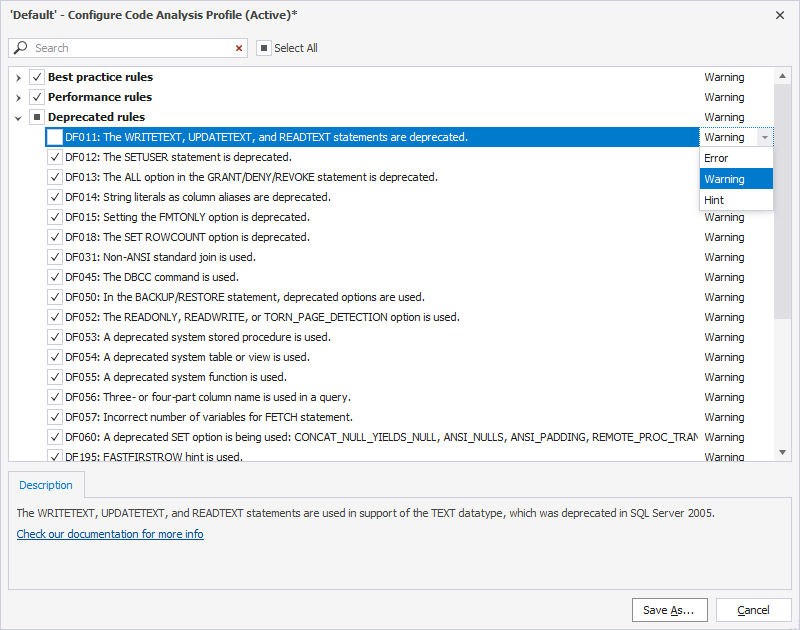
3. In the dialog that opens, select the code analysis rules you want to apply to your code.
By default, all the rules are selected. To exclude the rule from the profile settings, clear the corresponding checkbox.
4. After making all the necessary modifications, select Save. To save the modified profile as new, select Save As, specify a name for a new profile, and then select OK.
dbForge Studio for SQL Server allows you to create multiple custom code analysis profiles. For instructions, see Customize T-SQL Code Analyzer.