Customize T-SQL Code Analyzer
T-SQL Code Analyzer has a default code analysis profile containing all the code analysis rules provided by dbForge Studio. You can also create custom profiles for your specific needs.
Create a custom T-SQL Analyzer profile
To create a custom code analysis profile:
1. Select Tools > Options > Code Analysis > Profiles.
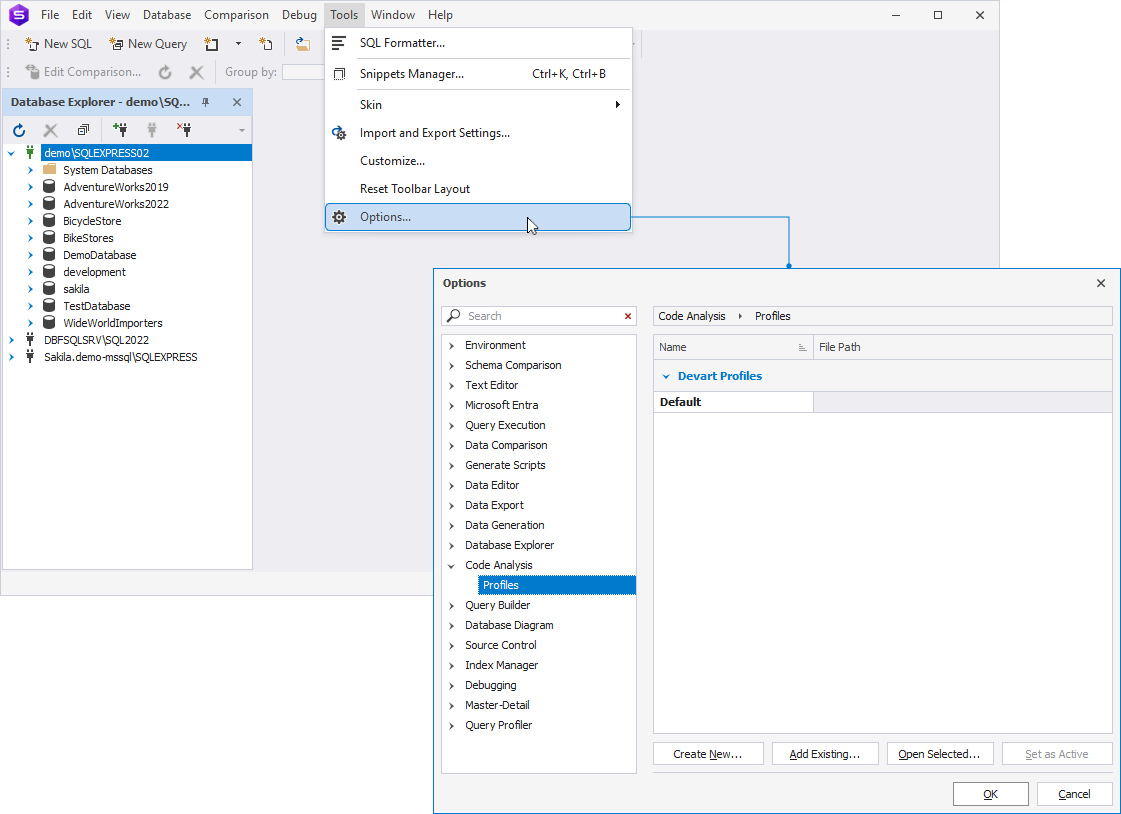
2. Click Create New.
3. In the dialog that opens, specify a name for the new profile, select the profile to copy the settings from, and enter the file path to store the XML file with the profile settings.
4. Optional: To make the profile active, keep the Set Active checkbox selected.
5. Click OK to create a new profile.
The new profile will appear in the list of profiles.
Change the settings of the profile
To change the settings of the code analysis profile:
1. Select Tools > Options > Code Analysis > Profiles.
2. Select the profile you want to modify, then click Open Selected.
3. In the dialog that opens, select the code analysis rules you want to apply to your code.
By default, all the rules are selected. To exclude a rule from the profile, clear its corresponding checkbox.
4. Optional: Choose the type of the message to display when a rule is triggered: Warning, Error, or Hint. To do this, select the message type from the list next to the corresponding rule.
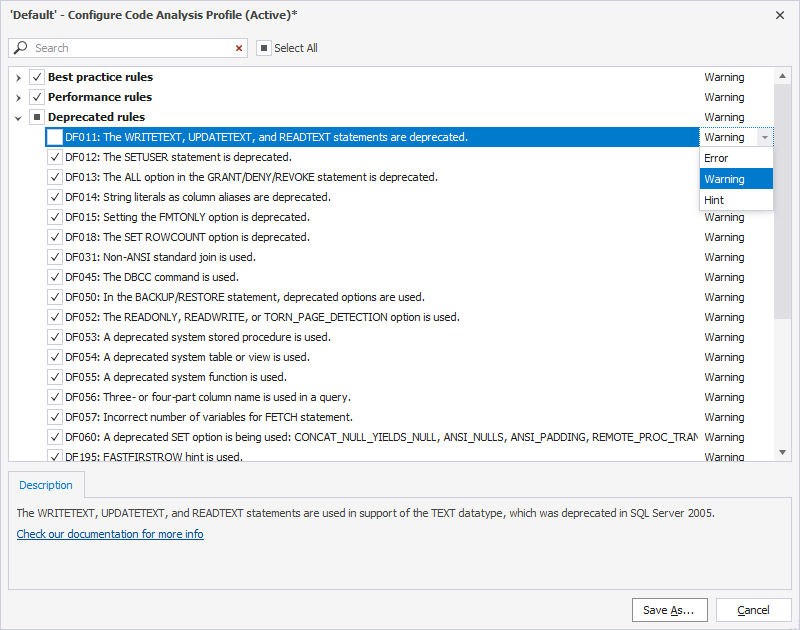
5. Click Save. To save the modified profile as new, click Save As, specify a name for a new profile, then click OK.