Debugger overview
The debugger in dbForge Studio for PostgreSQL enables you to monitor the runtime behavior of your database objects and locate logic errors. With the debugger, you can break, or interrupt, the execution of a routine to examine its variables, inspect the call stack, and continue execution one statement at a time.
PostgreSQL doesn’t provide a built-in debugging interface for client applications. Debugging requires the standard debugging module to be installed on the server, but this module is unavailable on most managed PostgreSQL services. For this reason, dbForge Studio includes its own debug mechanism. It consists of two parts:
- The debug engine. This is a set of functions and procedures that dbForge Studio deploys into the cr_debug schema of the database you’re going to debug.
- The debug information that dbForge Studio injects into the body of a routine when you use the Compile for Debugging command.
Note
After debugging, execute the Compile operation to remove the debug information from the routine.
Before executing the Compile for Debugging or Compile operation, make sure to back up the database.
For more information, see Set up the debug engine.
What you can debug
The debugger works with routines written in PL/pgSQL (LANGUAGE plpgsql):
- Functions (scalar,
SETOF,TABLE,RECORD,void, and functions that return a composite type or a domain). - Procedures, including procedures that call
COMMITandROLLBACK. - Trigger functions.
- Event trigger functions.
What you can’t debug
The debugger doesn’t support:
- Routines written in:
LANGUAGE sqlLANGUAGE plcoffeeLANGUAGE pljavaLANGUAGE pllsLANGUAGE plluaLANGUAGE plperlLANGUAGE plperluLANGUAGE plphpLANGUAGE plpython3uLANGUAGE plrLANGUAGE plrubyLANGUAGE plschemeLANGUAGE plshLANGUAGE pltclLANGUAGE pltclu
- Built-in routines written in:
LANGUAGE internalLANGUAGE c
- Routines checked with
plpgsql_check. - Anonymous
DOblocks. - Overloaded functions and procedures (support is planned).
Access the debugger
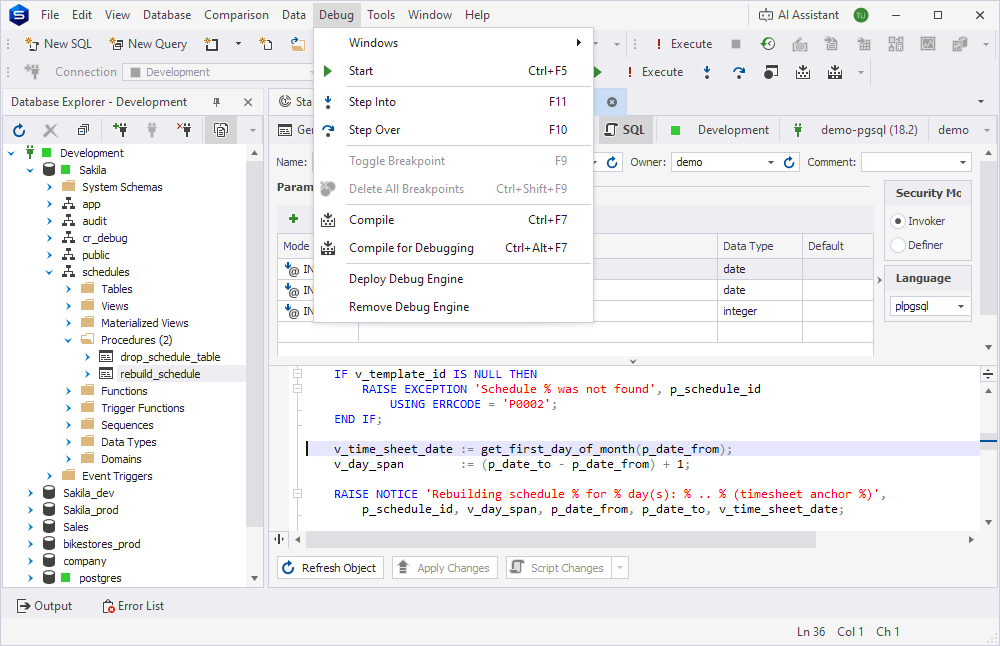
To access the debugger, use the Debug menu or the Debug toolbar.
Debug menu
On the menu bar, open the Debug menu to access debugging commands.
Debug toolbar
The Debug toolbar appears automatically when you start debugging.

The table describes the options available on the toolbar.
| Icon | Name | Description |
|---|---|---|
 |
Start Debugging | Starts a debugging session. |
 |
Continue | Resumes execution after a break, until the next breakpoint, a Run To Cursor position, or the end of the routine. |
 |
Execute Entire Script | Executes an entire script. |
 |
Stop Debugging | Terminates the debugging session. |
 |
Restart | Stops the current run and immediately starts a new one. |
 |
Step Into | Executes the next statement, entering any routine it calls. |
 |
Step Over | Executes the next statement without stopping inside the routines it calls. |
 |
Step Out | Resumes execution until the current routine returns. |
 |
Breakpoints | Opens the Breakpoints window. |
 |
Call Stack | Opens the Call Stack window. |
 |
Watches | Opens the Watches window. |
For more information about controlling execution, see Control execution while debugging.
Debug layout
dbForge Studio supports two window layouts:
- Default layout, which is used during regular development tasks.
- Debug layout, which is automatically applied when you start a debugging session.
Each layout keeps its state when you start or stop debugging, or when you exit and restart dbForge Studio.
Debugger windows
The debugger provides the following windows to help you monitor and control a debugging session: Breakpoints, Watches, and Call Stack.
Breakpoints
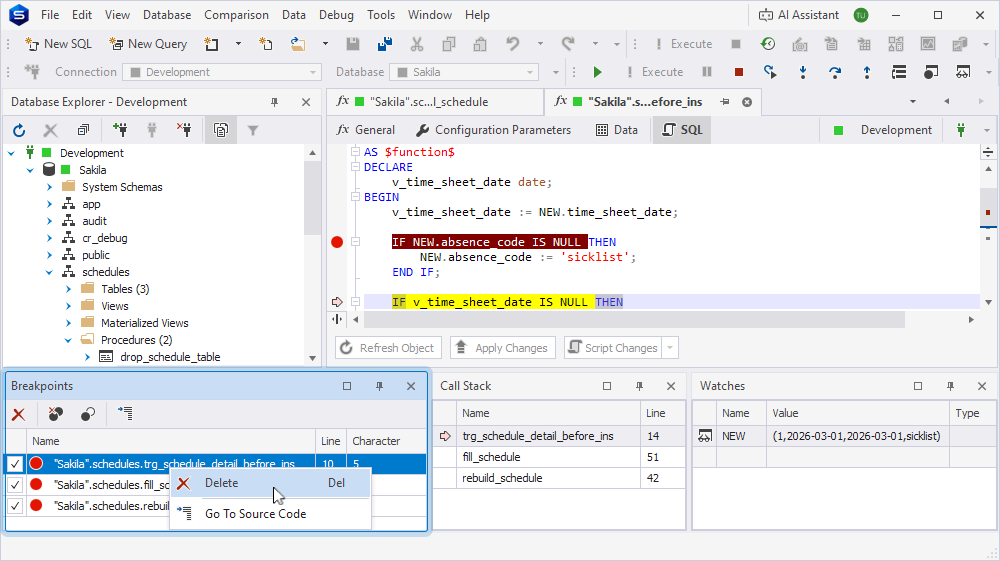
The Breakpoints window displays all the breakpoints that are currently set and their properties. You can use this window to delete, turn on, or turn off breakpoints, or navigate to the corresponding source code.
To open the window, use one of these ways:
- On the menu bar, select Debug > Windows > Breakpoints.
- On the Debug toolbar, click .
- Press Ctrl+D, B.
The grid in the Breakpoints window displays the following:
- Checkbox – The breakpoint status. When selected (default), the breakpoint is turned on.
- Name – The location of the breakpoint: the schema and routine names.
- Line – The line number in the source code where the breakpoint is set.
- Character – The character position (column number) where the breakpoint is set on that line.
To work with a breakpoint, right-click it in the grid and select the required option from the shortcut menu.
| Shortcut menu option | Description |
|---|---|
| Delete | Deletes the breakpoint. |
| Go To Source Code | Navigates you to the line of code in the source script where the breakpoint is set. |
Breakpoints toolbar
The Breakpoints window has its own toolbar that lets you manage breakpoints.
| Icon | Name | Description |
|---|---|---|
 |
Delete | Deletes the selected breakpoint. |
 |
Delete All Breakpoints | Deletes all breakpoints. |
 |
Disable/Enable All Breakpoints | Toggles all breakpoints at once: turns them off if at least one is turned on, and turns them on if all of them are turned off. |
 |
Go To Source Code | Navigates you to the line of code in the source script where the selected breakpoint is set. |
For more information on breakpoints, see Work with breakpoints.
Watches
Note
The Watches window is available only in the debug layout.
The Watches window shows the values of the variables and parameters you want to monitor.
To open the window, use one of these ways:
- On the menu bar, select Debug > Windows > Watches.
- On the Debug toolbar, click .
- Press Ctrl+D, W.
The grid displays the following:
- Name – An identifier or expression being monitored, for example, a variable.
- Value – The current value of the variable or expression when execution is paused at a breakpoint or after a debugging step.
- Type – The data type of the variable or expression being watched.
The grid also shows the watch status.
| Icon | Status | Description |
|---|---|---|
 |
Watch successfully added | The watch is valid, and its value is tracked and refreshed at every break. |
 |
Watch cannot be evaluated | The watch can’t be evaluated, and its value isn’t tracked. |
To manage watches, right-click the grid or a watch and select the required option from the shortcut menu.
| Shortcut menu option | Description |
|---|---|
| Add Watch | Adds a copy of the watch to the grid. |
| Delete Watch | Deletes the watch. |
| Copy | Copies the watch to the clipboard. |
| Paste | Inserts the copied watch into the grid. |
| Select All | Selects all watches. |
| Clear All | Removes all watches. |
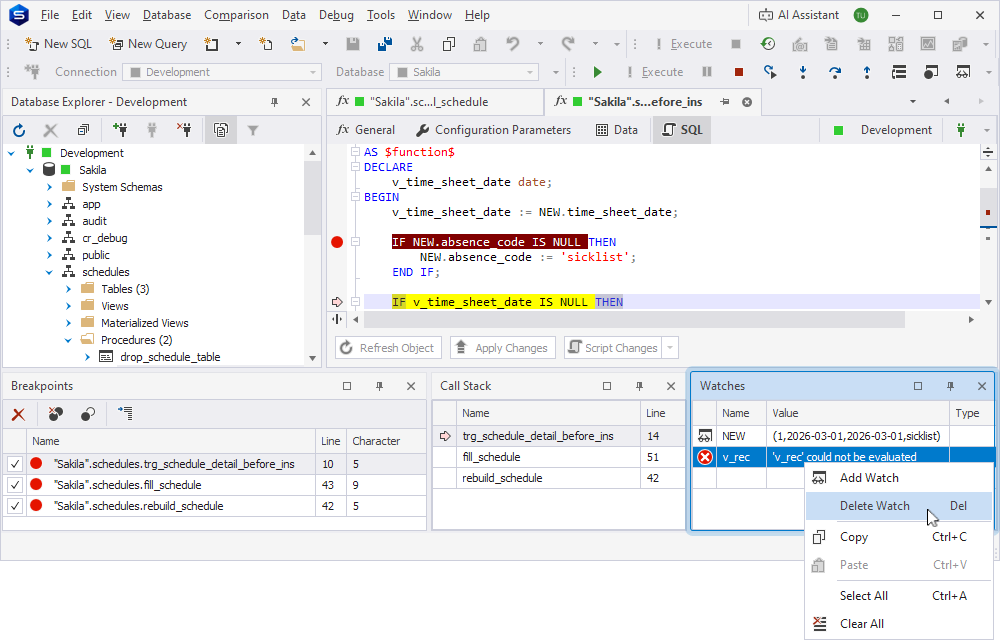
To add a variable to the watch list, right-click it in the routine editor and select Add Watch. The value is refreshed each time execution is paused, so you can see how it changes as you step through the code.
A variable declared in a procedure has no value while the debugger is inside a function that procedure called. To watch a value while inside that function, add a watch for one of the function’s own variables from its code instead.
Besides plain variables, the Watches window shows composite values, such as RECORD and %ROWTYPE variables, arrays, json and jsonb values, values of user-defined composite types, enums, and domains, as well as the special trigger variables NEW, OLD, and TG_* when you debug a trigger function.
Note
The debugger doesn’t yet evaluate expressions that include variables and constants, such as
v_a - v_borv_a - 1, and treats them as literal text.
Call Stack
Note
The Call Stack window is available only in the debug layout.
The Call Stack window shows the chain of calls that led to the statement the debugger stopped at.
To open the window, use one of these ways:
- On the menu bar, select Debug > Windows > Call Stack.
- On the Debug toolbar, click .
- Press Ctrl+D, C.
The grid displays the following:
- Name – The name of the routine on that stack frame.
- Line – The line number in the source code where the debugger is currently paused, or where the call was made from.
To work with a stack frame, right-click it in the grid and select the required option from the shortcut menu.
| Shortcut menu option | Description |
|---|---|
| Go To Source Code | Navigates to the source code associated with the selected stack frame. |
| Copy | Copies the stack frame to the clipboard. |
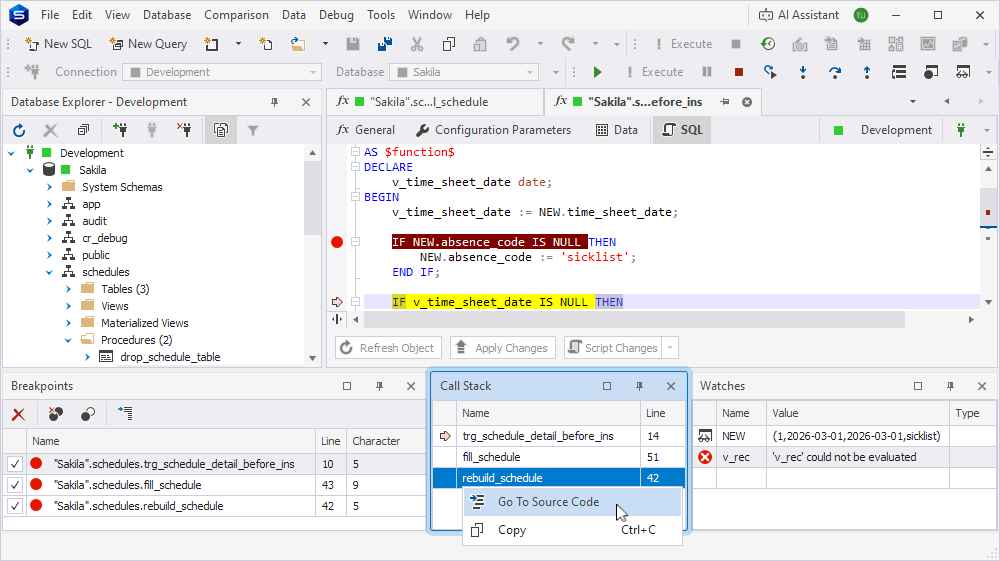
The uppermost frame in the window is the routine that’s currently executing; below it are the routines that called it.
A yellow arrow marks the frame where the execution pointer is located. Double-click any other frame to open the code of that routine. A green arrow marks the statement from which the call was made.
The Call Stack window lets you see how deep a recursive routine has gone and switch between frames in a call chain that contains both functions and procedures.