Getting Query Profiling Results
When you execute a query, Query Profiler generates profiling results and a query plan, which appear in a tree view with the execution date and time. The tool allows you to track and compare profiling results and determine whether your changes improve execution time before applying optimization steps.
Note
You can also use dbForge AI Assistant to explore the bottlenecks of your code and optimize performance.
Prerequisites
To demonstrate how Query Profiler works, use the following two SELECT statements based on the sakila database and film_actor and actor tables. The first query is inefficient primarily due to excessive nested subqueries and redundant calculations, which may lead to poor performance. The second query is optimized, faster, more efficient, and scalable due to reduced redundant calculations, structured CTEs, and effective join strategies.
Query with poor performance
SELECT actor_id, first_name, last_name, total_films
FROM (
SELECT a.actor_id, a.first_name, a.last_name,
(SELECT COUNT(*)
FROM sakila.film_actor fa
WHERE fa.actor_id = a.actor_id) AS total_films
FROM sakila.actor a
) actor_film_count
WHERE total_films > (
SELECT AVG(total_films)
FROM (
SELECT COUNT(*) AS total_films
FROM sakila.film_actor
GROUP BY actor_id
) sub_avg
)
ORDER BY total_films DESC;
Query with optimized performance
WITH actor_film_counts AS (
SELECT fa.actor_id, COUNT(*) AS total_films
FROM sakila.film_actor fa
GROUP BY fa.actor_id
),
average_films AS (
SELECT AVG(total_films) AS avg_films
FROM sakila.actor_film_counts
)
SELECT a.actor_id, a.first_name, a.last_name, afc.total_films
FROM sakila.actor a
JOIN actor_film_counts afc ON a.actor_id = afc.actor_id
JOIN average_films af ON afc.total_films > af.avg_films
ORDER BY afc.total_films DESC;
Profile a query
1. On the standard toolbar, select New SQL.
2. In a SQL document that opens, enter the following SELECT script:
SELECT actor_id, first_name, last_name, total_films
FROM (
SELECT a.actor_id, a.first_name, a.last_name,
(SELECT COUNT(*)
FROM sakila.film_actor fa
WHERE fa.actor_id = a.actor_id) AS total_films
FROM sakila.actor a
) actor_film_count
WHERE total_films > (
SELECT AVG(total_films)
FROM (
SELECT COUNT(*) AS total_films
FROM sakila.film_actor
GROUP BY actor_id
) sub_avg
)
ORDER BY total_films DESC;
3. To activate the Query Profiler tool, on the SQL toolbar, select  Query Profiling Mode.
4. To get profiling results for the query, on the SQL toolbar, select Execute or press F5.
The Profiler document view opens, displaying profiling results in two sections:
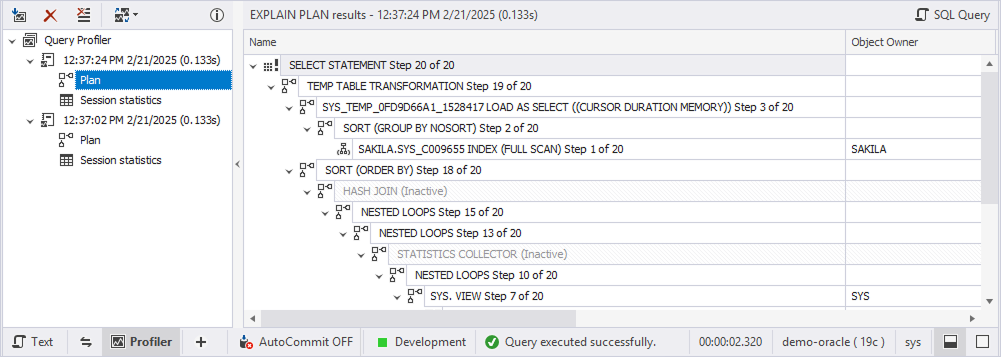
- Plan - Shows the execution plan for the query and how the database engine processes it. This helps identify inefficiencies, such as costly joins, missing indexes, or complete table scans.
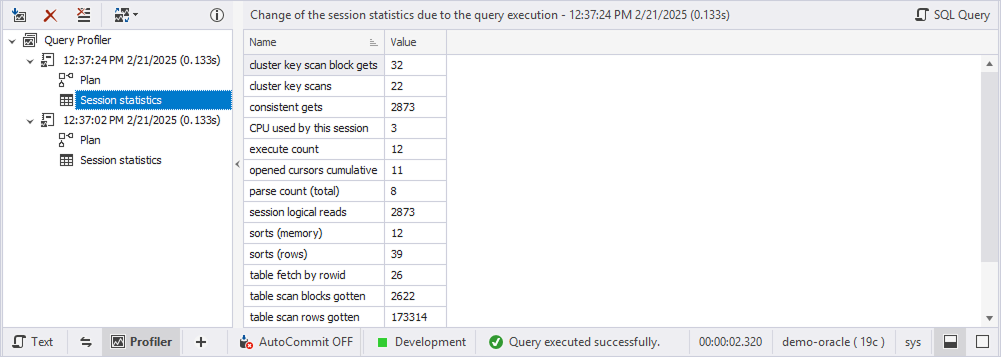
- Session Statistics - Provides performance metrics for the query execution, including CPU time, execution duration, memory usage, and I/O operations. This section helps diagnose performance bottlenecks.

5. In the same SQL document, enter the following optimized script:
WITH actor_film_counts AS (
SELECT fa.actor_id, COUNT(*) AS total_films
FROM sakila.film_actor fa
GROUP BY fa.actor_id
),
average_films AS (
SELECT AVG(total_films) AS avg_films
FROM sakila.actor_film_counts
)
SELECT a.actor_id, a.first_name, a.last_name, afc.total_films
FROM sakila.actor a
JOIN actor_film_counts afc ON a.actor_id = afc.actor_id
JOIN average_films af ON afc.total_films > af.avg_films
ORDER BY afc.total_films DESC;
6. To run the query, select it, and on the SQL toolbar, select Execute or press F5.
7. To get new results, on the Query Profiler toolbar, select ![]() Get New Results.
The new profiling results appear in the tree view as a new node with the time and date of the query execution. You can easily distinguish and navigate to them.
Get New Results.
The new profiling results appear in the tree view as a new node with the time and date of the query execution. You can easily distinguish and navigate to them.
Note
When you save the query file after getting the query profiling results, the latter will be automatically stored in the .Design file.
View query profiling results
In the Query Profiler tree, you can view the following query profiling results:
- Common information about the query execution, including the date and time required to execute the query.
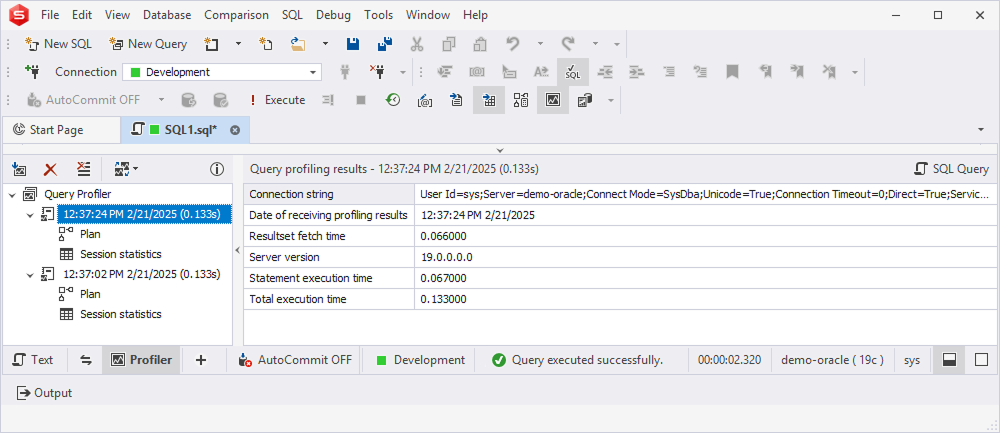
- Explain Plan Tree that represents the hierarchical execution of the steps and objects that the query accesses.
- Session statistics that displays the changes in the session statistics due to the query execution.
Use the Query Profiler toolbar
The Query Profiler toolbar contains the following options:

The following table provides toolbar options and their description.
| Option Icon | Name | Description |
|---|---|---|
| Get New Results | Select the option to get new results. | |
| Remove Results | Select the option to remove obtained results. | |
| Clear History | Select the option to clear history. | |
| Compare Results | Select the option to set the autoselection of the non-batch query profiling results for comparison. The automatic selection always works for batch queries and is equal to 100 (maximum) profiling results. The available options are Not Compare (default), Compare last two results, Compare last three results, Compare last four results, and Compare last five results. |