


Comparing Query Profiling Results
Last modified: March 13, 2025
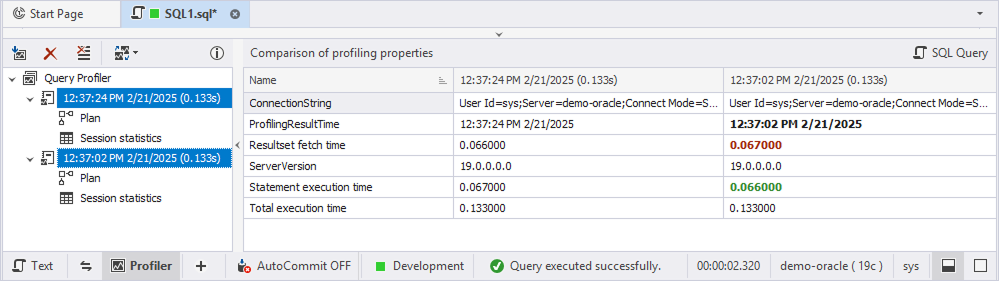
When comparing multiple queries, Query Profiler collects and displays profiling data, using green to highlight optimal performance and red to indicate inefficiencies.
To compare the profiling results, hold CTRL and select both plan diagrams in the tree view. The differences appear in the grid, with green showing improvements and red specifying performance issues.
For example, you can compare profiling properties of queries:
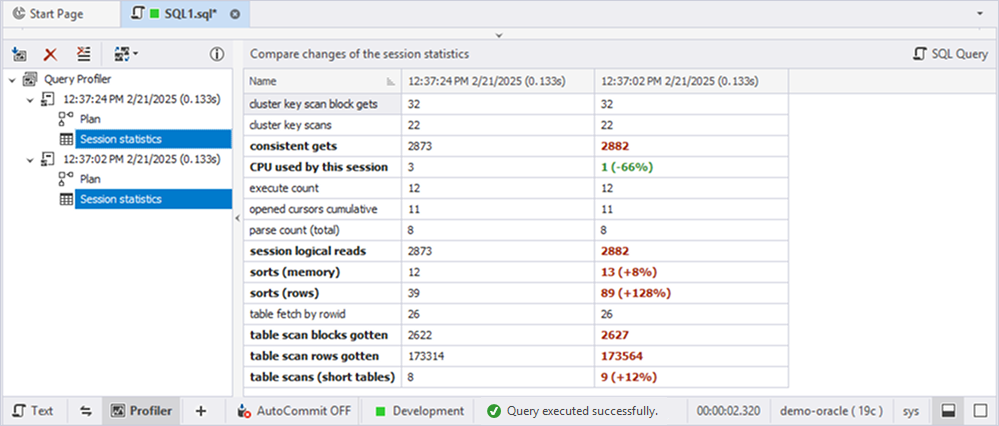
You can also compre changes of the session statistics:
'%3e%3cpath%20id='thumb_up_2'%20d='M15%2017H5.5V7L11.5%201L12.1667%201.45833C12.4028%201.625%2012.5833%201.83681%2012.7083%202.09375C12.8333%202.35069%2012.8681%202.61806%2012.8125%202.89583L12.7917%203L12%207H17.5C17.9167%207%2018.2708%207.14583%2018.5625%207.4375C18.8542%207.72917%2019%208.08333%2019%208.5V9.6875C19%209.79861%2018.9896%209.89931%2018.9688%209.98958C18.9479%2010.0799%2018.9167%2010.1736%2018.875%2010.2708L16.3944%2016.0875C16.2703%2016.3625%2016.0833%2016.5833%2015.8333%2016.75C15.5833%2016.9167%2015.3056%2017%2015%2017ZM7%2015.5H15L17.5%209.6875V8.5H10.1667L11.1875%203.4375L7%207.625V15.5ZM5.5%207V8.5H2.5V15.5H5.5V17H1V7H5.5Z'%20fill='%2327282C'/%3e%3c/g%3e%3c/g%3e%3c/svg%3e) Yes
Yes'%3e%3cpath%20id='thumb_down_2'%20d='M5%203H14.5V13L8.5%2019L7.83333%2018.5417C7.59722%2018.375%207.41667%2018.1632%207.29167%2017.9062C7.16667%2017.6493%207.13194%2017.3819%207.1875%2017.1042L7.20833%2017L8%2013H2.5C2.08333%2013%201.72917%2012.8542%201.4375%2012.5625C1.14583%2012.2708%201%2011.9167%201%2011.5V10.3125C1%2010.2014%201.01042%2010.1007%201.03125%2010.0104C1.05208%209.92014%201.08333%209.82639%201.125%209.72917L3.60417%203.91667C3.71528%203.63889%203.89931%203.41667%204.15625%203.25C4.41319%203.08333%204.69444%203%205%203ZM13%204.5H5L2.5%2010.3125V11.5H9.83333L8.8125%2016.5625L13%2012.375V4.5ZM14.5%2013V11.5H17.5V4.5H14.5V3H19V13H14.5Z'%20fill='%2327282C'/%3e%3c/g%3e%3c/g%3e%3c/svg%3e) No
NoWant to find out more?
'%3e%3cpath%20id='Vector'%20d='M4%204V24H24V4H4ZM22%2022H6V9H22V22ZM19%2019H9V18H19V19ZM19%2016H9V15H19V16ZM19%2013H9V12H19V13ZM21%202H2V21H0V0H21V2Z'%20fill='%230071CE'/%3e%3c/g%3e%3cdefs%3e%3cclipPath%20id='clip0_676_40052'%3e%3crect%20width='24'%20height='24'%20fill='white'/%3e%3c/clipPath%3e%3c/defs%3e%3c/svg%3e)
Overview
Take a quick tour to learn all about the key benefits delivered by dbForge Studio for Oracle.

All features
Get acquainted with the rich features and capabilities of the tool in less than 5 minutes.

Request a demo
If you consider employing this tool for your business, request a demo to see it in action.

