How to Debug a Trigger in Oracle Database
This example shows how to debug an Oracle trigger using the Oracle PL/SQL Debugger built into dbForge Studio for Oracle. Use the scripts below to create sample objects in your test database.
For the demo, we will do the following:
- create a stored procedure
- create a trigger
- compile the trigger
- debug a trigger
Creating a procedure
We will use the stored procedure created in Debugging a Stored Procedure.
Creating a trigger
For the demo, we will create the IU_SCHEDULE_DETAIL trigger that generates an error message when Timesheetdate is not equal to the first date of a month.
To create a trigger, do the following:
- In Database Explorer, right-click the Triggers folder and click New Trigger.
-
In the document that opens, copy and paste the following script.
CREATE OR REPLACE TRIGGER IU_SCHEDULE_DETAIL BEFORE INSERT ON SCHEDULE_DETAIL FOR EACH ROW BEGIN IF (GETFIRSTDAYOFMONTH(:NEW.DATEOUT) <> :NEW.TIMESHEETDATE) THEN RAISE_APPLICATION_ERROR(-20000, ''); END IF; END; - To save the changes, click Apply Changes or press Shift + Alt + A.
Compiling a trigger
To debug Oracle triggers, you should first compile them with debug information.
To compile the trigger for debugging, do the following:
-
In Database Explorer, right-click the trigger you want to compile, click Compile, and then select one of the following options on the shortcut menu:
- Compile for Debugging: Loads debugging information for the selected object.
- Compile References for Debugging: Loads debugging information for the objects that are linked to the selected object.
- Compile Dependants for Debugging: Loads debugging information for the objects on which the selected object is dependent.
-
In the compiling window that opens, the object you want to compile is selected by default. Click Compile, and then click Close.
Debugging a Trigger
To debug an Oracle trigger, do the following:
- In Database Explorer, expand the Triggers folder and then double-click the trigger you have created and compiled for debugging.
-
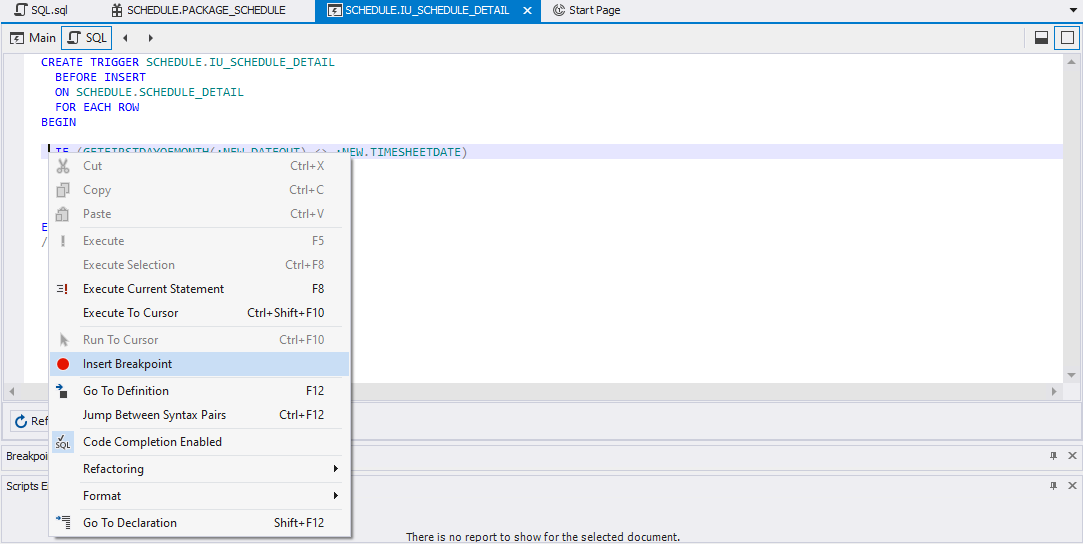
Switch to the SQL view to set a breakpoint for the trigger.
Note
The Main view is set as default. You cannot insert a breakpoint in the Main view.
-
Right-click the line of the code you want to break on and click Insert Breakpoint on the shortcut menu.
Note:
If you do not set a breakpoint in the trigger, you will skip over its code when you try to step into it.
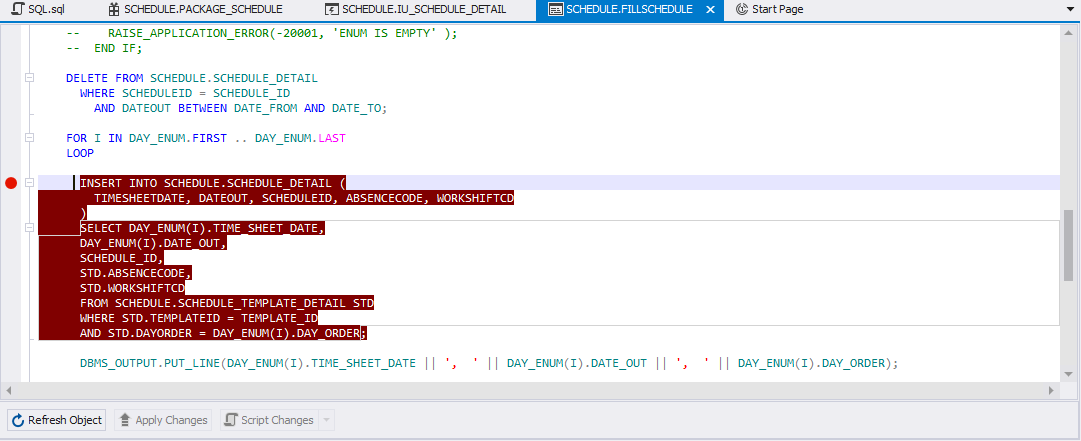
- In Database Explorer, expand the Procedures folder, and then double-click the FILLSCHEDULE procedure to open it.
-
In the FILLSCHEDULE procedure document that opens, right-click next to the INSERT INTO SCHEDULE.SCHEDULE_DETAIL statement and click Insert Breakpoint to set a breakpoint for the stored procedure that will fire the trigger.
- On the Debug toolbar, click
 Start Debugging and enter input parameters for the procedure.
 -
To step through the code, click
 Step Into or press F11.
Alternatively, you can click
 Continue or press Ctrl + F5 to move directly to the breakpoint.
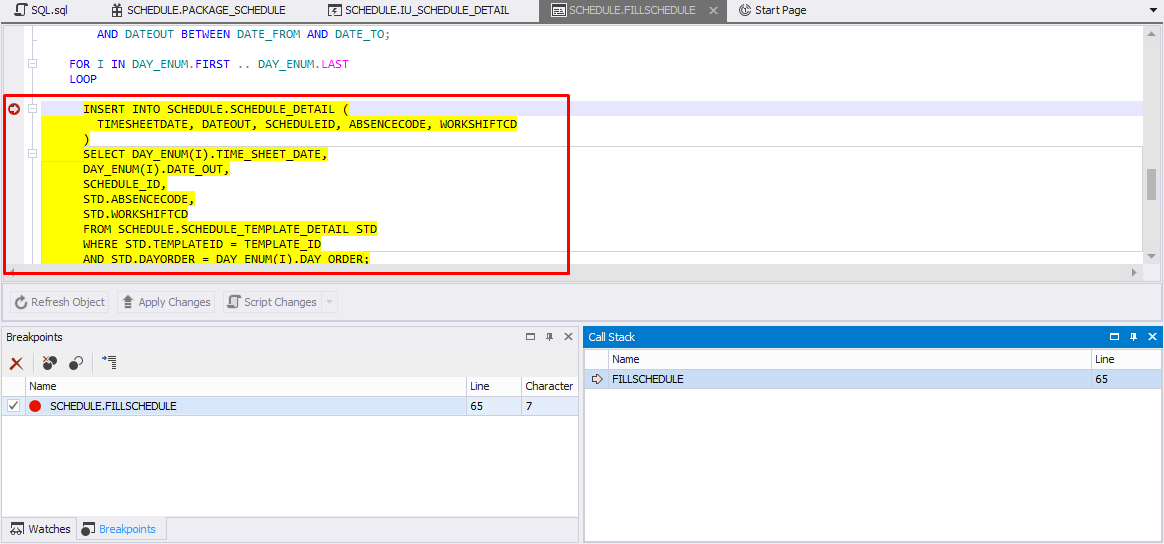
At the INSERT INTO SCHEDULE.SCHEDULE_DETAIL statement, when you press F11 again, you will step into the trigger.
- Step through the trigger until you return to the stored procedure, and continue to the end.
Tips & Tricks
If you want to set a breakpoint, the trigger should be executable. To execute the triger, select the code, right-click the code, and click  Execute Current Statement or press F8.
If you want to remove the breakpoint you have set, right-click the breakpoint in the document and click Delete Breakpoint on the shortcut menu.
Execute Current Statement or press F8.
If you want to remove the breakpoint you have set, right-click the breakpoint in the document and click Delete Breakpoint on the shortcut menu.
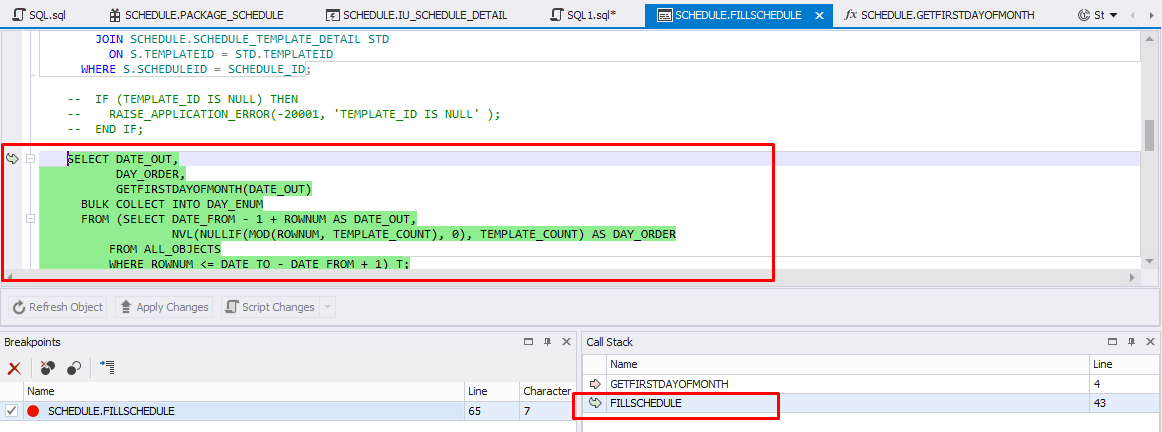
Call Stack pane
There are two database objects in the Call Stack pane: the trigger and the procedure. The yellow arrow next to the trigger indicates the stack frame where the execution pointer is currently located. The green arrow indicates that you have stepped back to the parent code that has called the trigger. You can get back to the procedure source code. To do this, double-click the procedure in the Call Stack pane.