Debug a stored procedure
This example demonstrates how to debug an Oracle stored procedure using PL/SQL Debugger for Oracle built into dbForge Studio for Oracle. It also illustrates different debugging techniques such as setting breakpoints, viewing data items, and so on. In this topic, sample database objects are created with the help of dbForge Studio for Oracle.
For the demo, we will do the following:
- create a database and insert data into it
- create a stored procedure
- execute a stored procedure
- compile the procedure
- debug a procedure
Create a test database and populate it with tables
Before you start debugging a stored procedure, it’s required to create a test database in dbForge Studio for Oracle and then fill it with tables.
1. To create the database, right-click a connection node and select New SQL.
2. Execute this query.
CREATE USER <your_username> IDENTIFIED BY <your_password>
DEFAULT TABLESPACE USERS
TEMPORARY TABLESPACE TEMP
QUOTA UNLIMITED ON USERS;
2. Grant minimal privileges for the created user to be able to login to the database and create and manage schema objects (tables, views, indexes, etc.).
GRANT CONNECT, RESOURCE TO <your_username>;
3. To add data to the created database, right-click it, then select New SQL.
4. Copy this script and paste it into the SQL document. The script creates four tables - SCHEDULE, SCHEDULE_DETAIL, SCHEDULE_TEMPLATE_DETAIL, and WORK.
-- Create table: SCHEDULE_DETAIL
CREATE TABLE SCHEDULE_DETAIL (
  ScheduleId     NUMBER(11)    NOT NULL,
  DateOut        DATE          NOT NULL,
  TimeSheetDate  DATE          NOT NULL,
  AbsenceCode    VARCHAR2(25),
  WorkShiftCd    VARCHAR2(25),
  CONSTRAINT pk_scheduledetail PRIMARY KEY (ScheduleId, DateOut)
);

-- Create table: SCHEDULE_TEMPLATE_DETAIL
CREATE TABLE SCHEDULE_TEMPLATE_DETAIL (
  TemplateId   NUMBER(11)    NOT NULL,
  DayOrder     NUMBER(11)    NOT NULL,
  AbsenceCode  VARCHAR2(25),
  WorkShiftCd  VARCHAR2(25),
  CONSTRAINT pk_scheduletemplatedetail PRIMARY KEY (TemplateId, DayOrder)
);

-- Insert values into SCHEDULE_TEMPLATE_DETAIL
INSERT INTO SCHEDULE_TEMPLATE_DETAIL (TemplateId, DayOrder, AbsenceCode, WorkShiftCd) VALUES (1, 1, NULL, '1/10');
INSERT INTO SCHEDULE_TEMPLATE_DETAIL (TemplateId, DayOrder, AbsenceCode, WorkShiftCd) VALUES (1, 2, NULL, '1/11,5');
INSERT INTO SCHEDULE_TEMPLATE_DETAIL (TemplateId, DayOrder, AbsenceCode, WorkShiftCd) VALUES (1, 3, NULL, '1/10');
INSERT INTO SCHEDULE_TEMPLATE_DETAIL (TemplateId, DayOrder, AbsenceCode, WorkShiftCd) VALUES (1, 4, NULL, '1/11,5');
INSERT INTO SCHEDULE_TEMPLATE_DETAIL (TemplateId, DayOrder, AbsenceCode, WorkShiftCd) VALUES (1, 5, NULL, '1/10');
INSERT INTO SCHEDULE_TEMPLATE_DETAIL (TemplateId, DayOrder, AbsenceCode, WorkShiftCd) VALUES (1, 6, 'offdays', NULL);
INSERT INTO SCHEDULE_TEMPLATE_DETAIL (TemplateId, DayOrder, AbsenceCode, WorkShiftCd) VALUES (1, 7, 'offdays', NULL);
INSERT INTO SCHEDULE_TEMPLATE_DETAIL (TemplateId, DayOrder, AbsenceCode, WorkShiftCd) VALUES (2, 1, NULL, '2/11,5');
INSERT INTO SCHEDULE_TEMPLATE_DETAIL (TemplateId, DayOrder, AbsenceCode, WorkShiftCd) VALUES (2, 2, NULL, '1/11,5');
INSERT INTO SCHEDULE_TEMPLATE_DETAIL (TemplateId, DayOrder, AbsenceCode, WorkShiftCd) VALUES (2, 3, NULL, '2/11,5');
INSERT INTO SCHEDULE_TEMPLATE_DETAIL (TemplateId, DayOrder, AbsenceCode, WorkShiftCd) VALUES (2, 4, NULL, '1|11.5');
INSERT INTO SCHEDULE_TEMPLATE_DETAIL (TemplateId, DayOrder, AbsenceCode, WorkShiftCd) VALUES (2, 5, NULL, '1/11,5');
INSERT INTO SCHEDULE_TEMPLATE_DETAIL (TemplateId, DayOrder, AbsenceCode, WorkShiftCd) VALUES (2, 6, 'offdays', NULL);
INSERT INTO SCHEDULE_TEMPLATE_DETAIL (TemplateId, DayOrder, AbsenceCode, WorkShiftCd) VALUES (2, 7, 'offdays', NULL);
INSERT INTO SCHEDULE_TEMPLATE_DETAIL (TemplateId, DayOrder, AbsenceCode, WorkShiftCd) VALUES (3, 1, NULL, '1#8');
INSERT INTO SCHEDULE_TEMPLATE_DETAIL (TemplateId, DayOrder, AbsenceCode, WorkShiftCd) VALUES (3, 2, NULL, '1.0');
INSERT INTO SCHEDULE_TEMPLATE_DETAIL (TemplateId, DayOrder, AbsenceCode, WorkShiftCd) VALUES (3, 3, 'business_trip', NULL);

-- Create table: SCHEDULE
CREATE TABLE schedule (
  ScheduleId  NUMBER(11) PRIMARY KEY,
  TemplateId  NUMBER(11)
);

-- Insert values into SCHEDULE
INSERT INTO schedule (ScheduleId, TemplateId) VALUES (1, 5);
INSERT INTO schedule (ScheduleId, TemplateId) VALUES (2, 1);
INSERT INTO schedule (ScheduleId, TemplateId) VALUES (3, 3);
INSERT INTO schedule (ScheduleId, TemplateId) VALUES (4, 2);
INSERT INTO schedule (ScheduleId, TemplateId) VALUES (5, 4);

-- Create table: WORK
CREATE TABLE WORK (
  DATE_OUT DATE,
  DAY_ORDER NUMBER(*, 0),
  TIME_SHEET_DATE DATE
);
5. On the Standard toolbar, click Execute.
Create a stored procedure
To create the FillSchedule procedure, do the following:
1. In Database Explorer, right-click the Procedures folder and click New Procedure on the shortcut menu.
2. In the document that opens, copy, and paste the following script.
CREATE OR REPLACE PROCEDURE C##BIGBONE.FILLSCHEDULE(
  DATE_FROM   IN DATE,
  DATE_TO     IN DATE,
  SCHEDULE_ID IN INT
)
AS
  TEMPLATE_COUNT SMALLINT;
  TEMPLATE_ID    INT;
  DAY_COUNT      INT;

  TYPE ENUM_TYPE IS TABLE OF REC_OBJ;
  DAY_ENUM       ENUM_TYPE;

  DAY_ENUM2      REC_OBJ;

BEGIN
  DAY_ENUM2 := REC_OBJ(DATE_FROM, NULL, SYSDATE);
  DAY_ENUM2.ADMIT(1);

  INSERT INTO WORK (
    DATE_OUT, DAY_ORDER, TIME_SHEET_DATE
  ) VALUES (
    DAY_ENUM2.DATE_OUT,
    DAY_ENUM2.DAY_ORDER,
    DAY_ENUM2.TIME_SHEET_DATE
  );

  SELECT COUNT(*), MAX(S.TEMPLATEID)
    INTO TEMPLATE_COUNT, TEMPLATE_ID
    FROM SCHEDULE S
    JOIN SCHEDULE_TEMPLATE_DETAIL STD ON S.TEMPLATEID = STD.TEMPLATEID
    WHERE S.SCHEDULEID = SCHEDULE_ID;

  SELECT REC_OBJ(
           DATE_OUT,
           DAY_ORDER,
           GETFIRSTDAYOFMONTH(DATE_OUT)
         )
    BULK COLLECT INTO DAY_ENUM
    FROM (
      SELECT DATE_FROM - 1 + ROWNUM AS DATE_OUT,
             NVL(NULLIF(MOD(ROWNUM, TEMPLATE_COUNT), 0), TEMPLATE_COUNT) AS DAY_ORDER
        FROM ALL_OBJECTS
        WHERE ROWNUM <= DATE_TO - DATE_FROM + 1
    );

  DAY_COUNT := DAY_ENUM.COUNT;

  DELETE FROM SCHEDULE_DETAIL
    WHERE SCHEDULEID = SCHEDULE_ID
      AND DATEOUT BETWEEN DATE_FROM AND DATE_TO;

  FOR I IN DAY_ENUM.FIRST .. DAY_ENUM.LAST
  LOOP
    INSERT INTO SCHEDULE_DETAIL (
      TIMESHEETDATE, DATEOUT, SCHEDULEID, ABSENCECODE, WORKSHIFTCD
    )
    SELECT
      DAY_ENUM(I).TIME_SHEET_DATE,
      DAY_ENUM(I).DATE_OUT,
      SCHEDULE_ID,
      STD.ABSENCECODE,
      STD.WORKSHIFTCD
    FROM SCHEDULE_TEMPLATE_DETAIL STD
    WHERE STD.TEMPLATEID = TEMPLATE_ID
      AND STD.DAYORDER = DAY_ENUM(I).DAY_ORDER;

    DBMS_OUTPUT.PUT_LINE(DAY_ENUM(I).TIME_SHEET_DATE || ', ' || DAY_ENUM(I).DATE_OUT || ', ' || DAY_ENUM(I).DAY_ORDER);
  END LOOP;

END;
/
3. To save the changes, click Apply Changes or press Shift + Alt + A.
The procedure has two input parameters: DateFrom and DateTo. Based on these input parameters the table is populated with test data.
Assume that we need to get Time Sheet for a specific time period. For this, we need to execute the procedure.
Execute the stored procedure
To debug a stored procedure, it should be executable.
To execute the FillSchedule procedure, do the following:
1. In Database Explorer, choose your test database and double-click the Procedures folder to open it.
2. Right-click the FillSchedule procedure and click Execute on the shortcut menu.
3. In the Edit Parameters:<procedure_name> dialog box, enter input parameters.
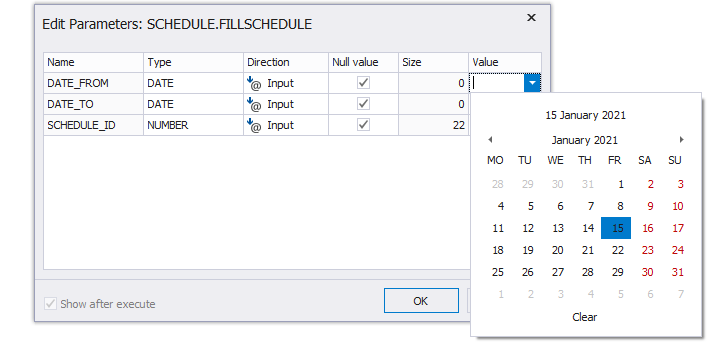
The pop-up window informing about the successful completion and the execution time appears.
4. To complete the process, click Ok.
Compile the stored procedure
Prior to debugging, you should compile the stored procedure for debugging. Otherwise, dbForge Studio for Oracle prompts you to compile it.
To compile the stored procedure for debugging, do the following:
-
In Database Explorer, right-click the procedure you want to compile, click Compile, and then select one of the following options on the shortcut menu:
- Compile for Debugging: Loads debugging information for the selected object.
- Compile References for Debugging: Loads debugging information for the objects that are linked to the selected object.
- Compile Dependants for Debugging: Loads debugging information for the objects on which the selected object is dependent.
-
In the compiling window that opens, the object you want to compile is selected by default. Click Compile, and then Close.
Debugg the stored procedure
To start debugging the stored procedure, do the following:
-
On the Debug toolbar, click
 Start Debugging or press Ctrl + F5.
Note:
If you have not compiled the procedure, the dbForge Studio prompts you to compile it. In the pop-up window that opens, click Yes. In the Edit Parameters:<procedure_name> dialog box, specify the input parameters once again and click OK.
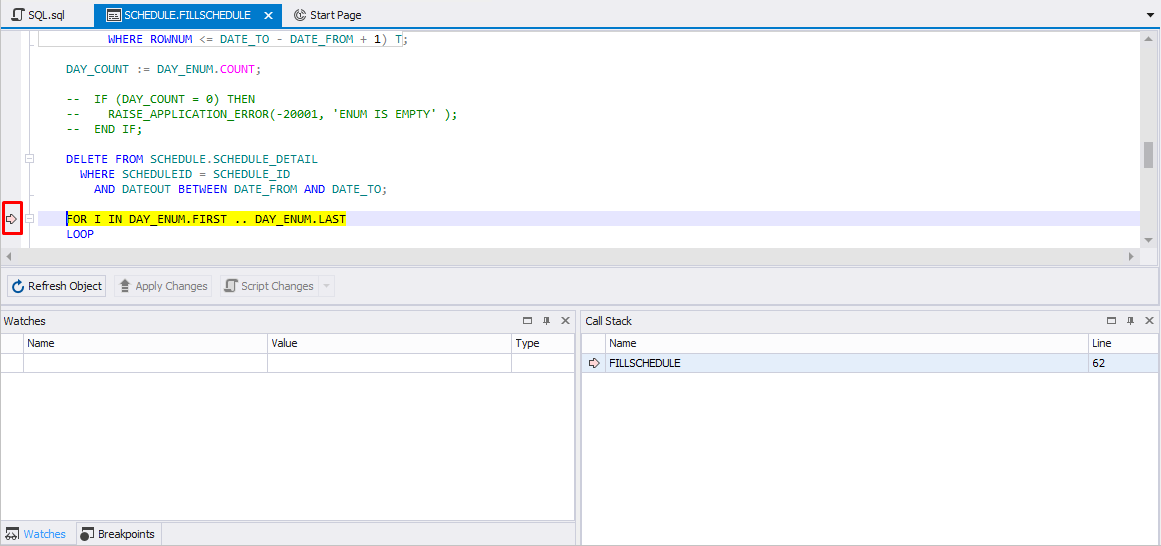
You can see that the yellow arrow identifies the stack frame where the execution pointer is currently located.
The Watches pane displays information about variables, their value, and type.
The Call Stack pane displays the line of the code where Oracle PL/SQL Debugger is currently located.
-
To set a breakpoint, use one of the following options:
- On the Debug toolbar, click
 Breakpoints
 - Right-click a line of executable code where you want to set a breakpoint and click Insert Breakpoint on the shortcut menu. For more information about how to manage breakpoints, see Working with Breakpoints.
- Press Ctrl + D, B
- On the Debug toolbar, click
- To stop the debugging process, click
 Stop Debugging on the Debug toolbar or press Shift + F5.
 - To proceed with debugging, click
 Continue or press Ctrl + F5.
Tips & Tricks
In the Debug layout mode, you can use the following options:
- Continue (or press Ctrl + F5) to proceed with the debugging process until it reaches the next breakpoint or the end of the debugging process.
 Step Into (or press F11) to instruct the debugger to execute the next line of the code. If the line contains a function call, Step Into executes only the call itself, then halts at the first line of the code inside the function.
 Step Over (or press F10) to execute the entire function, then halts at the first line outside the function. Also, the command can be used to avoid stepping into functions.
 Step Out (or press Shift + F11) to run the current function and it stops the execution until the current function is returned or the breakpoint occurs.
After the debugging of the stored procedure has stopped, you can execute it. For this, on the Standard toolbar, click Execute. In the pop-up window informing that the stored procedure has been executed successfully, click Ok.
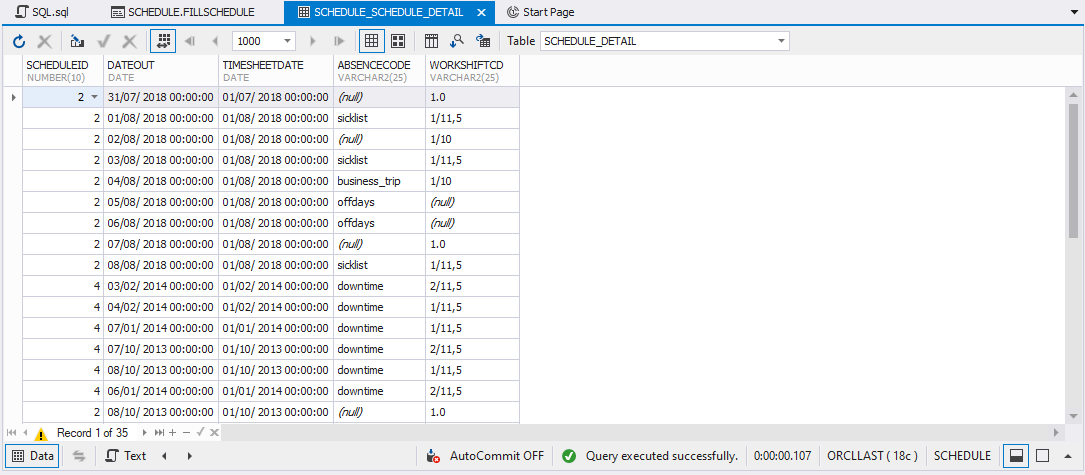
To verify this, you can retrieve the data from the table. To do this, perform the following steps:
- In Database Explorer, choose the database from which you want to retrieve the data.
- Double-click the Tables folder, right-click the table you need and click Retrieve Data on the shortcut menu.
-
In the document that opens, you can view the retrieved data on the results grid.